Organizations need more than financial results to understand whether their strategies are working. Revenue, profitability, and cash flow show important aspects of performance, but they do not always explain customer outcomes, process efficiency, or the capabilities required for future success.
The Balanced Scorecard (BSC) is a strategic performance management framework that helps organizations translate strategy into objectives, performance measures, targets, and initiatives. It connects financial and nonfinancial indicators to provide a broader view of organizational performance.
The framework helps managers communicate strategic priorities, monitor progress, and assess how different areas of performance relate to one another. Its effectiveness depends on the quality of its design, the relevance of its indicators, and how consistently the organization uses it to guide decisions.
This article explains what the Balanced Scorecard is, how its four perspectives work, how to develop a strategy map, and how organizations can implement and manage a Balanced Scorecard system.
What Is the Balanced Scorecard?
The Balanced Scorecard is a strategic management and performance measurement framework that connects an organization’s strategy with measurable objectives and coordinated action. It combines financial measures with nonfinancial indicators to provide a broader assessment of performance.
Traditional performance reporting often places substantial emphasis on financial results. Although these indicators show what has happened financially, they may offer limited insight into the operational and organizational factors behind those results.
The Balanced Scorecard addresses this limitation by examining performance through four perspectives:
Financial: How should the organization perform financially?
Customer: How should the organization perform in the eyes of its customers?
Internal processes: Which internal processes must perform well?
Learning and growth: Which capabilities, skills, and organizational conditions support future performance?
These perspectives connect different aspects of organizational performance. For example, investments in employee capabilities may improve internal processes, which can contribute to better customer outcomes and, ultimately, stronger financial performance.
The Balanced Scorecard is therefore more than a dashboard or a collection of KPIs. It links strategic objectives, indicators, targets, and initiatives within a coordinated management system.
Why Is the Balanced Scorecard Important?
Organizations can collect extensive performance data and still struggle to determine whether their activities support strategic priorities. Departments may track different indicators, managers may interpret objectives differently, and operational initiatives may proceed without a clear connection to the overall strategy.
The Balanced Scorecard provides a structure for addressing these challenges.
1. Connect strategy with performance measurement
The framework translates broad strategic priorities into explicit objectives and measurable results. This connection helps managers identify what the organization needs to achieve and how progress will be assessed.
2. Provide a broader view of performance
Financial results remain important, but they represent only one perspective. Customer outcomes, internal processes, and organizational capabilities can help explain the conditions that contribute to financial performance over time.
3. Improve strategic alignment
A Balanced Scorecard can help departments and business units connect their objectives to organizational priorities. This alignment requires clear communication and careful consideration of what each unit can influence.
4. Support communication and accountability
A structured scorecard clarifies objectives, indicators, targets, responsibilities, and reporting expectations. Managers can use it to discuss results and determine which actions require attention.
5. Support strategy review and recalibration
Performance results can reveal gaps between expected and actual outcomes. Organizations can investigate these gaps, review their assumptions, and revise objectives or initiatives when circumstances or strategic priorities change.
Research supports the importance of implementation quality. A 2022 systematic literature review by Kumar, Prince, and Baker examined 114 Balanced Scorecard articles published between 1992 and 2021. The authors highlighted management support, communication, coordination, and relationships among the four perspectives as relevant implementation considerations. Read the academic review of Balanced Scorecard research.
What Are the Four Balanced Scorecard Perspectives?
The four perspectives provide different but connected views of organizational performance. The indicators within each perspective should reflect the organization’s strategy rather than follow a universal list.
1. Financial perspective
The financial perspective examines whether the organization’s strategy supports its financial objectives. Relevant measures depend on the organization’s business model, ownership structure, and strategic priorities.
Common examples include:
Return on investment (ROI)
Revenue growth
Cash flow
Profitability
Operating costs
A commercial organization may prioritize profitability and revenue growth, while a public or nonprofit organization may place greater emphasis on budget utilization, financial sustainability, or responsible resource allocation.
Financial indicators show important results, but managers should also examine the operational and customer-related factors that contribute to those results.
2. Customer perspective
The customer perspective examines how the organization intends to create and maintain relationships with its customers or service users.
Possible indicators include:
Customer satisfaction rate
Customer retention rate
Customer complaints
Market share
Customer acquisition or conversion rate
For example, a company that prioritizes customer retention may monitor satisfaction, repeat purchases, and service quality. A public service organization may assess service-user satisfaction, accessibility, or the timeliness of service delivery.
The selected measures should reflect the customer outcomes that matter most to the strategy.
3. Internal processes perspective
The internal processes perspective focuses on the operational activities that contribute to customer and financial outcomes. It helps organizations identify which processes require improvement or closer monitoring.
Potential indicators include:
Process cycle time
Error or defect rate
Service delivery time
Process automation rate
Resource utilization
Compliance with process standards
An organization that seeks to improve service delivery, for instance, may monitor turnaround time, process errors, and the proportion of cases completed within the required period.
The relevant processes depend on the organization’s strategic priorities. Measuring every operational activity can produce an unwieldy scorecard, so selection should focus on processes with a clear relationship to strategic objectives.
4. Learning and growth perspective
The learning and growth perspective examines the capabilities and organizational conditions that support current and future performance. It often includes employee skills, organizational culture, information systems, and the capacity to improve.
Possible indicators include:
Employee engagement or job satisfaction
Employee turnover
Training participation
Competency assessment results
Access to relevant information systems
Progress in developing critical capabilities
For example, an organization that plans to automate important processes may need employees with appropriate digital skills, reliable information systems, and a culture that supports learning.
These measures help managers assess whether the organization is developing the capabilities required to deliver its strategy over time.
How Does the Balanced Scorecard Work?
A Balanced Scorecard system connects strategic direction with objectives, performance measures, and initiatives. The components work together rather than operate as separate reporting tools.
A typical architecture includes the following elements:
Component
Purpose
Key question
Desired state of evolution
Defines the organization’s intended direction through its mission, vision, values, and goals
Where does the organization want to go?
Strategy map
Organizes strategic objectives and shows their proposed cause-and-effect relationships across the four perspectives
What must the organization achieve, and how are the objectives connected?
Performance scorecard
Connects objectives to KPIs, targets, and thresholds
How will progress be measured?
Dashboard
Presents performance information for monitoring and review
What do the results show?
Portfolio of initiatives
Organizes the projects and actions intended to achieve strategic objectives
What will the organization do to achieve its objectives?
These components support different stages of strategic management. The strategy map communicates the logic of the strategy, the scorecard specifies how performance will be measured, the dashboard presents results, and the initiative portfolio tracks the work intended to produce the desired outcomes.
What Is a Balanced Scorecard Strategy Map?
A Balanced Scorecard strategy map is a visual representation of an organization’s strategic objectives and the relationships proposed between them. It helps explain how objectives across the four perspectives contribute to the overall strategy.
Consider an airline that wants to improve profitability while maintaining high safety standards.
Its strategy map might connect objectives as follows:
Learning and growth: Develop employee skills and strengthen the safety culture.
Internal processes: Reduce turnaround time, improve resource utilization, and maintain safety standards.
Customer: Improve on-time performance and offer competitive pricing.
Financial: Increase revenue and profitability while managing operating costs.
The logic is that stronger employee capabilities and safety practices may support more reliable operations. Better operations may improve the customer experience and support financial objectives.
These connections represent strategic hypotheses that management should assess through performance data and operational evidence. A strategy map does not prove that one objective will automatically cause another. Its purpose is to make the proposed relationships explicit so they can be discussed, tested, and revised.
How to Implement a Balanced Scorecard
A Balanced Scorecard implementation requires more than creating a strategy map and choosing indicators. Organizations need to establish a clear strategic direction, assign responsibilities, and integrate the framework into their management routines.
Step 1: Assess the organization’s current position
Review the existing strategy, performance management practices, organizational structure, data availability, and stakeholder expectations.
The assessment should identify current strengths, measurement gaps, governance issues, and areas where departments lack a shared understanding of strategic priorities.
Step 2: Clarify strategy and organizational objectives
Define the organization’s desired direction, including its mission, vision, values, goals, and strategic priorities.
Objectives should describe what the organization intends to achieve. They should be clear enough to guide performance measurement and decision-making.
Step 3: Develop the strategy map
Arrange the objectives across the four perspectives and identify the proposed relationships among them.
Review whether the objectives collectively support the strategy, whether important dependencies are represented, and whether the proposed cause-and-effect relationships are reasonable.
Step 4: Select KPIs and define targets
Choose indicators that measure progress toward the objectives. For each KPI, establish a clear definition, calculation method, data source, reporting frequency, and responsible owner.
Targets should reflect strategic expectations, historical performance, available resources, and relevant external or internal evidence. Thresholds can help identify when results require attention.
Avoid selecting indicators solely because data is readily available. The KPI must measure something relevant to the objective.
Step 5: Identify and prioritize initiatives
Determine which projects, programs, or activities are required to achieve the objectives. Assign initiative owners and establish milestones, budgets, timelines, and progress measures where appropriate.
Initiatives should have a clear connection to strategic objectives. A long list of projects does not necessarily represent a coherent strategy execution plan.
Step 6: Align objectives across organizational levels
Translate organizational priorities into relevant objectives for business units, departments, and teams. This process is often described as alignment and cascading.
Cascading should preserve the connection to organizational strategy while accounting for the responsibilities and influence of each unit. Measures should not assign accountability for outcomes that a team cannot reasonably control.
Step 7: Monitor performance and recalibrate
Review KPI results and initiative progress at appropriate intervals. Investigate deviations, discuss their causes, and determine whether corrective action is required.
The organization may need to revise initiatives, adjust resource allocation, improve measurement practices, or reconsider strategic assumptions. Changes should follow a clear governance process so the scorecard remains consistent and useful.
What Is the Difference Between a Balanced Scorecard, a KPI Dashboard, and a Strategy Map?
These terms are related, but they describe different components or tools.
Tool
Primary purpose
Typical contents
Balanced Scorecard
Connects strategy, objectives, performance measures, targets, and initiatives
Strategic objectives, KPIs, targets, and linked management activities
KPI dashboard
Presents performance data for monitoring
KPI results, trends, status indicators, and visual summaries
Strategy map
Communicates strategic objectives and their proposed relationships
Objectives arranged across the four perspectives, with cause-and-effect links
A dashboard can display the results of selected KPIs without showing how those indicators relate to the strategy. A strategy map can communicate strategic logic without providing the detailed performance results found in a dashboard.
The Balanced Scorecard brings these elements together within a broader performance management system. The specific architecture varies by organization, but the essential purpose is to connect strategic intent with measurable performance and action.
Common Balanced Scorecard Implementation Challenges
Organizations can encounter several difficulties when designing or implementing a Balanced Scorecard.
Too many KPIs
A scorecard with excessive indicators can make it difficult to identify the measures that matter most. Select KPIs based on their relevance to strategic objectives and their usefulness in management decisions.
Weak links between objectives and measures
An indicator may be easy to measure but still fail to represent the intended objective. Each KPI should have a clear rationale and a documented relationship to the objective it measures.
Limited leadership support
Implementation can lose momentum when leaders do not communicate the purpose of the system, participate in reviews, or use performance information to guide decisions.
Poor data quality and inconsistent definitions
Different departments may calculate the same KPI in different ways or rely on data sources with inconsistent quality. Standard definitions, documented calculation rules, and clear ownership help address this problem.
Limited employee involvement
A scorecard designed entirely by senior management may overlook operational realities or assign responsibility for outcomes that employees cannot influence. Consultation with relevant stakeholders can improve the quality and practical relevance of the framework.
Treating the scorecard as a reporting exercise
A scorecard that produces reports without influencing decisions can become an administrative burden. Performance reviews should examine the meaning of results, the status of initiatives, and the actions required to address gaps.
A systematic literature review by Lueg and Vu examined empirical research on Balanced Scorecard implementation. Their findings highlighted the importance of design quality, individual and organizational factors, leadership, and organizational culture. The review also cautioned against treating implementation speed as the only measure of implementation success. Read the research on Balanced Scorecard implementation success factors.
How Can Organizations Assess Balanced Scorecard Effectiveness?
The effectiveness of a Balanced Scorecard should not be judged solely by whether the organization has completed a scorecard document or dashboard. The more important question is whether the framework supports strategic management and performance review.
Organizations can assess their approach by asking:
Are strategic objectives clearly defined and understood?
Do the four perspectives reflect the organization’s strategy?
Are the relationships between objectives explicit and credible?
Do the KPIs measure progress toward the objectives?
Are targets, thresholds, data sources, and responsibilities documented?
Do initiatives have clear owners, budgets, and milestones?
Do departments understand how their objectives connect to organizational priorities?
Are performance reviews followed by decisions or actions?
Does the organization revise its assumptions and measures when evidence indicates a need for change?
These questions can help identify gaps in the framework’s design and use. An assessment should consider the organization’s context, strategic maturity, governance arrangements, and the quality of available performance information.
Frequently Asked Questions About the Balanced Scorecard
What is the main purpose of the Balanced Scorecard?
The main purpose of the Balanced Scorecard is to connect organizational strategy with measurable objectives, performance indicators, targets, and initiatives. It provides a structured view of financial and nonfinancial performance and supports strategic communication, monitoring, and review.
What are the four perspectives of the Balanced Scorecard?
The four perspectives are financial, customer, internal processes, and learning and growth. Together, they help organizations assess financial results, customer outcomes, operational performance, and the capabilities required for future success.
What is the difference between a KPI and a Balanced Scorecard?
A KPI is a measure used to assess performance in relation to an objective or expected result. The Balanced Scorecard is a broader framework that connects strategic objectives with KPIs, targets, and initiatives across the four perspectives.
What is a Balanced Scorecard strategy map?
A strategy map is a visual representation of strategic objectives and their proposed cause-and-effect relationships across the four perspectives. It helps communicate how different objectives contribute to the organization’s overall strategy.
Is the Balanced Scorecard suitable for public-sector organizations?
Yes. Public-sector organizations can adapt the Balanced Scorecard to their mandates, stakeholder requirements, and intended outcomes. They may place greater emphasis on service delivery, public outcomes, accountability, and resource stewardship than on profitability.
What are the main components of a Balanced Scorecard management system?
A Balanced Scorecard management system can include a desired state of evolution, strategy map, performance scorecard, dashboard, and portfolio of initiatives. Supporting documentation may include KPI definitions, KPI trend analyses, initiative descriptions, and project status reports.
How often should a Balanced Scorecard be reviewed?
Review frequency depends on the organization’s operating context, the indicators being monitored, and the speed at which relevant conditions change. Operational indicators may require frequent monitoring, while strategic reviews may occur monthly, quarterly, or at another interval suited to the organization’s governance process.
If you’re ready to put the Balanced Scorecard into practice, enroll in The KPI Institute’s Certified Balanced Scorecard Management System Professional course. Explore the practical application, test your knowledge, and strengthen your ability to design and manage a Balanced Scorecard system.
*********
Editor’s Note: This article is based on the learning content of The KPI Institute’s Certified Balanced Scorecard Management System Professional course, which explores the principles, components, and practices involved in developing and managing a Balanced Scorecard system.
Agile strategy execution is an approach to implementing organizational strategy through flexible planning, timely decisions, regular performance reviews, cross-functional collaboration, and continuous improvement. It helps organizations respond to changes in their business environment while keeping day-to-day activities, projects, and resources connected to strategic objectives.
Traditional strategy plans often establish priorities and targets for a defined period. However, customer needs, market conditions, technology, regulations, and internal capabilities can change before that period ends. Agile strategy execution gives organizations a structured way to review new information, adjust implementation, and maintain focus on the results they need to achieve.
Agility does not mean changing strategic priorities whenever a new challenge appears. It means establishing clear objectives, monitoring progress, and making deliberate adjustments when evidence or circumstances justify them.
This guide covers:
What agile strategy execution means and why it matters
The difference between strategy planning and strategy execution
The five stages of the strategy management framework
The core principles of agile strategy execution
How to align and manage strategic initiatives
Performance measurement, reporting, and strategy review cycles
The role of leadership, governance, communication, and technology
Practical examples, common challenges, and frequently asked questions
What Is Agile Strategy Execution?
Agile strategy execution is the process of implementing strategic plans through an adaptable management system that supports timely decisions, access to relevant data, collaboration, and iterative improvement. It connects strategic objectives to organizational activities and allows implementation to be reviewed and adjusted as conditions change.
Strategy execution turns a strategic plan into coordinated action. It requires organizations to assign accountability, allocate resources, manage initiatives, monitor performance, and review whether their actions are producing the intended results.
The agile element introduces flexibility into this process. Instead of relying only on a fixed annual plan and periodic reviews, organizations establish regular opportunities to examine performance, respond to emerging issues, and revise actions when necessary.
The KPI Institute’s Certified Agile Strategy Execution Professional course materials describe strategy management as a process of formulating, implementing, monitoring, and adapting to changes. They distinguish strategy planning, which focuses on formulation, from strategy execution, which puts strategic plans into practice.
Why Does Agile Strategy Execution Matter?
A strategy may be clearly written and supported by ambitious objectives, yet implementation can still encounter obstacles. Teams may pursue conflicting priorities, initiatives may compete for resources, decisions may take too long, or performance information may arrive too late to support corrective action.
Agile strategy execution addresses these challenges through a structured process for translating strategy into coordinated work, monitoring results, and reviewing priorities.
It can help organizations:
Respond to change. Review strategic assumptions and revise actions when external conditions or internal capabilities change.
Improve decision speed. Establish clear decision rights so operational issues do not require unnecessary escalation.
Align teams. Connect departmental plans and cross-functional activities to shared strategic objectives.
Allocate resources deliberately. Review the strategic contribution of initiatives and adjust resource commitments when priorities change.
Monitor performance. Use relevant indicators, scorecards, and dashboards to identify progress and emerging problems.
Focus on outcomes. Evaluate whether projects and initiatives deliver their intended benefits, rather than measuring progress only through completed tasks.
Support continuous improvement. Use regular reviews to identify lessons, address root causes, and improve subsequent actions.
Academic research provides evidence of a relationship between organizational agility and performance. A systematic literature review published in Management Review Quarterly examined 249 empirical studies on agility and organizational outcomes, covering research from 1998 to February 2024. The review found that 219 studies, or 87.9%, reported a positive relationship between different forms of agility and organizational outcomes. The authors also identified mixed and limited findings in some studies, which means results should be interpreted in context. Read the systematic literature review on the organizational impact of agility.
The evidence supports considering agility as part of organizational management, but it does not guarantee that adopting agile practices will produce the same results in every organization. Leadership, organizational culture, implementation quality, and the nature of the work remain important.
What Is the Difference Between Strategy Planning and Strategy Execution?
Strategy planning and strategy execution are connected, but they serve different purposes.
Strategy planning determines the strategic direction, objectives, priorities, and intended results. It considers the organization’s context, opportunities, threats, and capabilities before deciding what it should pursue.
Strategy execution translates those decisions into coordinated activities. It involves assigning responsibilities, allocating resources, managing initiatives, tracking performance, and addressing obstacles to implementation.
Agile strategy execution connects the two through regular feedback. Monitoring may reveal that an initiative is behind schedule, that a performance indicator is moving in the wrong direction, or that an assumption behind the strategy no longer holds. The organization can then decide whether to correct implementation, revise resource allocation, or reconsider the strategic direction itself.
Dimension
Strategy planning
Agile strategy execution
Primary question
What should the organization pursue?
How will the organization deliver the intended results and adapt when necessary?
Main activities
Environmental analysis, strategic direction, objective setting, and initiative selection
Implementation, resource allocation, performance monitoring, decision-making, and recalibration
Time orientation
Establishes the direction and intended results
Connects long-term direction to current priorities and regular reviews
Main outputs
Strategic objectives, targets, and strategic initiatives
Coordinated actions, performance results, decisions, and adjustments
Feedback
Tests assumptions and strategic choices
Uses performance evidence and changing conditions to revise actions or strategy
Neither activity works well in isolation. Planning without execution leaves strategic intentions unrealized. Execution without a clear strategic direction can produce busy teams whose work does not contribute to the organization’s main priorities.
What Is the Strategy Management Framework for Agile Strategy Execution?
The KPI Institute course materials present a five-stage strategy management framework: Plan, Translate, Implement, Monitor, and Recalibrate. The stages connect strategic direction with operational delivery and regular review.
The framework is supported by cross-cutting capabilities such as change management, leadership, stakeholder engagement, communication, and technology.
1. Plan: Establish the Strategic Direction
The planning stage establishes what the organization intends to achieve and why. It includes idea generation, environmental analysis, strategic direction, performance measurement, and the identification of strategic initiatives.
Activities may include:
Reviewing internal capabilities and external conditions
Identifying opportunities, threats, and strategic challenges
Defining strategic directions and objectives
Establishing performance measures and target levels
Identifying initiatives that support the strategic objectives
Example: A retail organization identifies customer retention as a strategic priority after reviewing customer feedback, sales patterns, and market conditions. It establishes a retention objective and identifies potential initiatives involving service quality, loyalty programs, and customer communication.
An agile approach does not eliminate planning. It recognizes that strategic assumptions may need to be reviewed as new evidence becomes available.
2. Translate: Connect Strategy to Organizational Work
The translation stage connects strategic objectives to the business units, departments, individuals, and cross-functional teams responsible for implementation.
This involves both vertical and horizontal alignment.
Vertical alignment connects organizational objectives with departmental, team, and individual responsibilities.
Horizontal alignment coordinates work between departments and teams whose contributions depend on one another.
Without alignment, departments may pursue targets that conflict with other priorities or launch initiatives without the support of the teams responsible for delivery.
Example: If customer retention is a strategic objective, the sales, customer service, marketing, and IT teams may each have responsibilities that contribute to the outcome. The teams agree on shared measures, clarify dependencies, and coordinate the activities needed to improve the customer experience.
3. Implement: Turn Strategic Priorities into Action
The implementation stage establishes the organizational conditions and management processes needed to deliver the strategy. The course framework includes organizational structure, resource allocation, the strategy execution system, and initiative management.
Key activities include:
Assigning responsibility and decision rights
Allocating budgets, people, and other resources
Establishing governance and escalation processes
Mapping the processes needed to achieve strategic objectives
Managing strategic initiatives and dependencies
Coordinating work across departments
A strategy execution system combines the tools, processes, and responsibilities needed to implement strategic objectives and projects. It should connect performance management with project management and clarify how strategic objectives are achieved through operational processes.
Example: The retail organization assigns an executive sponsor to the retention objective, appoints initiative owners, allocates resources, and defines how customer service, marketing, and IT will coordinate their work.
The focus should extend beyond whether project tasks are completed. Managers also need to examine whether the initiatives are producing the intended benefits.
4. Monitor: Measure Performance and Review Progress
The monitoring stage examines whether implementation is progressing as expected and whether the organization is moving toward its strategic objectives.
The course framework includes performance measurement, performance reporting, and operational performance review meetings.
Monitoring may involve:
Reviewing key performance indicators (KPIs) against targets
Examining scorecards and dashboards
Checking initiative milestones and resource use
Identifying performance gaps and emerging risks
Investigating the causes of unexpected results
Sharing relevant information with the people responsible for action
Different review meetings may serve different purposes. Operational teams may need frequent updates about immediate obstacles, while executives may need periodic reviews of strategic progress and major decisions.
Example: The retail organization reviews customer retention, repeat purchases, customer complaints, and initiative progress. If the retention indicator falls below the expected level, the team investigates the cause instead of assuming that completing planned activities will automatically produce the intended result.
5. Recalibrate: Adjust Strategy and Implementation
Recalibration involves reviewing evidence and deciding whether the organization should change its actions, resource allocation, initiatives, targets, or strategic direction.
It may be appropriate when:
Performance consistently falls below expectations
An initiative no longer contributes enough to the strategic objective
A major assumption behind the plan changes
New risks or opportunities emerge
Resources need to be redirected
Evidence suggests that the original approach is unlikely to achieve the intended result
Recalibration should follow a defined review process. A change should have a clear rationale, an accountable decision-maker, and a plan for communicating its implications.
Example: The retail organization finds that its loyalty program has increased customer registrations but has not improved repeat purchases. After reviewing customer behavior and feedback, the team changes the program’s design and tests the revised approach before expanding it.
The five stages form a continuous cycle. Monitoring provides information for recalibration, while lessons from recalibration feed into the next round of planning and implementation.
What Are the Core Principles of Agile Strategy Execution?
The course materials identify five principles of agile strategy execution: adaptability, quick decision-making, access to data, enhanced collaboration, and continuous improvement.
1. Adaptability
Adaptability is the ability to adjust plans and actions when circumstances change. An organization should be prepared to respond to emerging threats, opportunities, and new evidence without losing sight of its strategic objectives.
Adaptability does not mean that every new development requires a strategic change. The organization needs criteria for deciding which changes justify action and which do not.
Practical application: Define the conditions that trigger a strategy review, such as a material change in customer demand, a major regulatory development, or sustained underperformance against a strategic target.
2. Quick Decision-Making
Quick decision-making relies on clear governance, defined responsibilities, and appropriate employee autonomy. Teams should understand which decisions they can make independently and which require approval from a higher level.
Unclear decision rights can delay implementation even when the relevant information is already available.
Practical application: Establish decision boundaries for project teams, including budget limits, risk thresholds, and conditions that require escalation.
3. Access to Data
Timely access to relevant data allows teams to monitor performance, identify issues, and respond before problems become more difficult to address.
Access alone is insufficient. The information must be reliable, understandable, and relevant to the decisions being made.
Practical application: Provide teams with current performance dashboards, agreed KPI definitions, and access to the operational information needed to investigate performance gaps.
4. Enhanced Collaboration
Agile strategy execution requires coordination across functions, departments, and organizational levels. Cross-functional collaboration helps teams manage dependencies, share information, and address problems that cannot be resolved by one department alone.
Practical application: Hold regular cross-functional reviews for initiatives that depend on several departments. Record decisions, assign owners to actions, and revisit unresolved dependencies at the next review.
5. Continuous Improvement
Continuous improvement involves delivering work in manageable stages, examining results, and using lessons to improve subsequent efforts. It encourages teams to identify problems early rather than waiting until the end of a long implementation period.
Practical application: After each delivery cycle, review what was completed, what outcomes were observed, what obstacles arose, and what should change in the next cycle.
These principles reinforce one another. Adaptability is difficult without timely data, and quick decisions are harder to make without clear governance. Collaboration supports coordinated action, while continuous improvement gives the organization a regular way to learn from implementation.
How Does Agile Strategy Execution Manage Strategic Initiatives?
Strategic initiatives are projects, programs, or coordinated activities intended to contribute to strategic objectives. Initiative management is therefore a central part of strategy execution.
An organization may have many proposed initiatives, but its resources are limited. Agile strategy execution requires managers to review which initiatives deserve priority, how they depend on one another, and whether they are delivering the expected benefits.
Align Initiatives With Strategic Objectives
Each initiative should have a clear connection to one or more strategic objectives. Managers should be able to explain why the initiative matters and how its outcomes will contribute to the intended result.
An initiative that is completed on time may still have limited strategic impact if it does not address an important objective or produce the expected benefit.
Prioritize the Initiative Portfolio
Portfolio management helps organizations compare initiatives and make decisions about their relative priority. Relevant considerations may include strategic contribution, expected benefits, cost, resource requirements, risk, urgency, and dependencies.
The organization should review the portfolio when conditions change, rather than treating the original list of projects as permanently fixed.
Manage Dependencies and Resources
Initiatives often depend on the same employees, systems, budgets, or decisions. If these dependencies are not visible, one delayed initiative can affect several others.
Regular portfolio reviews can help managers identify resource conflicts, adjust sequencing, resolve cross-functional obstacles, and reconsider commitments.
Focus on Benefits Realization
Benefits realization examines whether an initiative produces the outcomes it was intended to deliver.
Project completion measures activities and outputs, such as whether a new system has been installed. Benefits measures examine the results that follow, such as reduced processing time, improved customer retention, or fewer operational errors.
Both types of measures matter, but they answer different questions.
Example: A company completes a customer relationship management system implementation. Completion confirms that the system was delivered. Benefits realization examines whether adoption has improved follow-up, shortened response times, or increased customer retention.
Agile strategy execution places particular emphasis on the relationship between initiatives and strategic outcomes. Managers need to review not only whether the work is progressing, but also whether it remains the right work to pursue.
How Does Performance Measurement Support Agile Strategy Execution?
Performance measurement provides the evidence needed to assess progress toward strategic objectives. It helps managers compare actual results with targets, identify performance gaps, and determine when further investigation or corrective action is needed.
Use KPIs to Track Strategic Objectives
A key performance indicator measures an aspect of performance that matters to an objective. Each KPI should have a clear definition, a measurement method, an owner, and an agreed reporting frequency.
For example, a customer retention objective may be monitored through the customer retention rate, repeat purchase rate, or customer churn rate. The choice depends on the objective and the decisions managers need to make.
A useful performance measurement system distinguishes between:
Outcome indicators, which measure the result the organization wants to achieve.
Output indicators, which measure products or services delivered through activities.
Activity or progress measures, which track whether planned work is taking place.
Activity measures can help monitor implementation, but they should not replace measures of the results that the strategy is intended to produce.
Use Scorecards and Dashboards
Scorecards and dashboards organize performance information so managers can review the indicators relevant to their responsibilities.
A dashboard may display current results, targets, trends, and alerts. A scorecard may organize performance measures around strategic objectives or performance perspectives.
These tools are most useful when the information is current, the indicators are clearly defined, and users know what action to take when results differ from expectations.
Combine Quantitative and Situational Analysis
Quantitative analysis examines numerical data, such as KPI results, costs, completion rates, and trends. Situational analysis considers contextual factors that may help explain a result, including changes in customer behavior, operational constraints, stakeholder feedback, or new external conditions.
Both approaches can be necessary. A KPI may reveal that performance has declined, but numerical data alone may not fully explain why. Managers may need to examine operational processes, speak with relevant teams, or investigate changing conditions.
The goal is to move from identifying a performance gap to understanding its possible causes and deciding what to do next.
What Is an Agile Strategy Review Cycle?
An agile strategy review cycle is a recurring process for examining strategic progress, making decisions, and adjusting implementation. It connects performance reporting with action rather than treating reports as an end in themselves.
The appropriate frequency depends on the decision being reviewed. A project team may need weekly progress meetings, operational managers may review performance monthly, and executives may conduct quarterly strategy reviews. These are examples of possible cadences, not universal requirements.
A practical review cycle includes the following activities:
Prepare the evidence. Gather current performance results, initiative updates, risk information, and relevant changes in the business environment.
Compare results with expectations. Identify which objectives are progressing as planned and which show significant gaps.
Investigate important differences. Examine possible root causes rather than relying on assumptions or a single indicator.
Make decisions. Determine whether to continue, correct, reprioritize, pause, or stop an initiative.
Assign follow-up actions. Identify owners, deadlines, resources, and expected results.
Communicate the decisions. Share relevant changes with teams and stakeholders affected by the decisions.
Review the outcome. At the next meeting, assess whether the actions addressed the problem and whether further adjustments are needed.
The course materials also discuss single-, double-, and triple-loop learning as ways to think about organizational review and learning.
Single-loop learning focuses on correcting an action or process to improve results while keeping the existing objective or underlying assumptions.
Double-loop learning examines whether the policies, objectives, or assumptions behind an action should change.
Triple-loop learning examines how the organization learns, makes decisions, and improves its overall approach to learning.
These concepts help distinguish between correcting implementation, reconsidering strategic assumptions, and improving the organization’s wider learning process.
What Capabilities Support Agile Strategy Execution?
Agile tools and review meetings are not enough on their own. Organizations also need leadership, governance, communication, stakeholder engagement, technology, and a culture that supports learning and adaptation.
Leadership and Governance
Leadership establishes strategic priorities, clarifies accountability, allocates resources, and resolves conflicts between competing objectives. Governance defines how decisions are made, who has authority, and when issues must be escalated.
A workable governance model provides control over important decisions without requiring senior approval for every operational adjustment.
Organizational Culture and Employee Autonomy
Teams need to understand strategic priorities and have appropriate authority to make decisions within their responsibilities. They also need an environment where people can raise concerns, discuss poor results, and report risks without unnecessary delay.
An organization that promotes agility in its procedures but discourages open communication may struggle to identify problems early.
Stakeholder Engagement and Communication
Strategy execution often affects employees, customers, partners, suppliers, and other stakeholders. Communication helps these groups understand changes, responsibilities, and expected outcomes.
Stakeholder engagement also provides information about practical implementation issues that may not be visible in performance dashboards alone.
Technology and Information Systems
Technology can support performance reporting, project management, collaboration, and access to current information. However, technology should support a coherent strategy execution system rather than become a separate collection of disconnected tools.
The organization needs consistent data definitions, clear reporting responsibilities, and systems that help teams coordinate their work.
Change Management
Change management is particularly important when strategic priorities, organizational structures, processes, or ways of working must change significantly.
Employees need to understand why a change is necessary, how it affects their responsibilities, and what support is available. Communication, training, stakeholder involvement, and regular feedback can help address implementation barriers.
Research published in Management Research Review examined strategy implementation in an automotive company through 39 semi-structured interviews. The study identified challenges involving meeting coordination, processes, integration, strategic mindset, communication, and information quality, and proposed an agile framework for strategy deployment. Its findings illustrate how strategy execution depends on more than project tools alone. Read How Can Strategy Implementation Become Agile?.
The study examined one company’s context, so its findings should not be treated as a universal checklist. It nevertheless highlights practical issues that organizations can examine when reviewing their own implementation processes.
What Are Examples of Agile Strategy Execution in Business?
The following examples are illustrative scenarios showing how the framework can be applied across different business functions.
Business area
Strategic objective
Agile strategy execution approach
How progress can be reviewed
Customer experience
Improve customer retention
Coordinate service, marketing, and product initiatives; review customer feedback and retention trends.
Review retention indicators and investigate recurring customer complaints.
Operations
Reduce service delays
Map operational processes, assign ownership, and test changes in manageable stages.
Compare processing times, backlogs, and error rates before and after changes.
Digital transformation
Increase adoption of a new platform
Deliver implementation in stages, gather user feedback, and resolve adoption barriers.
Monitor active usage, completion rates, and user support requests.
Finance
Improve cost control
Review spending against budget, examine major variances, and revise resource allocations when justified.
Review financial results and the operational causes of significant variances.
Human resources
Improve employee retention
Coordinate workforce initiatives, review employee feedback, and examine retention patterns.
Track turnover and related indicators while investigating differences across teams.
Sales
Improve conversion rates
Test sales process changes, coordinate marketing and sales teams, and review conversion data.
Compare conversion rates and investigate differences by customer segment or sales stage.
In each case, agile strategy execution connects strategic objectives with operational work and regular review. The organization does not change course simply because results fluctuate. It examines the evidence, identifies the significance of the issue, and decides whether an adjustment is justified.
What Are Common Challenges in Agile Strategy Execution?
Organizations may adopt agile project practices yet struggle to apply them across strategy management. Common challenges include:
Unclear strategic priorities. Teams cannot align their work when objectives are vague or competing priorities are unresolved.
Poor alignment across departments. Teams optimize their own activities without considering dependencies or shared outcomes.
Slow decision-making. Unclear decision rights and unnecessary approval steps delay implementation.
Limited access to reliable data. Managers cannot respond effectively when performance information is incomplete, outdated, or difficult to interpret.
Too many initiatives. The organization spreads resources across more projects than it can support.
Focus on activity rather than outcomes. Teams report completed tasks without checking whether the intended benefits have been achieved.
Irregular or ineffective reviews. Meetings produce reports but fail to result in decisions, assigned actions, or follow-up.
Resistance to change. Employees may not understand the reason for new priorities or may lack the support needed to work differently.
Agile tools without an agile mindset. Processes become more frequent or iterative, but leadership, governance, and culture continue to discourage adaptation.
These challenges require more than additional meetings or new software. Organizations need clear objectives, appropriate decision authority, reliable performance information, coordinated initiative management, and a review process that leads to action.
How Can Organizations Get Started With Agile Strategy Execution?
Organizations can begin by reviewing how strategy currently moves from planning into operational work. The following steps provide a practical starting point.
Review the existing strategy management process. Identify how objectives are translated into initiatives, how resources are allocated, and how performance is monitored.
Clarify strategic objectives and accountability. Confirm what the organization intends to achieve and who is responsible for each objective.
Review the initiative portfolio. Assess whether current initiatives support strategic priorities and whether resources are spread too thinly.
Clarify decision rights. Determine which decisions teams can make independently and which require escalation.
Set a regular review cycle. Establish meetings and reporting frequencies suited to the decisions being made.
Introduce structured recalibration. Define how performance gaps, new risks, and changing conditions trigger a review of actions or priorities.
Build collaboration and learning into the process. Encourage cross-functional problem-solving and review whether agreed actions have produced the intended results.
Assess and improve the system. Use experience from implementation to refine governance, reporting, communication, and resource allocation.
Organizations do not need to transform every process at once. They can start with a strategically important objective, test the review process, and use the lessons to improve implementation elsewhere.
Frequently Asked Questions About Agile Strategy Execution
What is agile strategy execution?
Agile strategy execution is an approach to implementing organizational strategy through adaptability, timely decisions, access to data, cross-functional collaboration, and continuous improvement. It connects strategic objectives to operational work and supports regular reviews of performance and changing conditions.
What are the five stages of agile strategy execution?
The strategy management framework presented in The KPI Institute’s course materials includes five stages: Plan, Translate, Implement, Monitor, and Recalibrate. Together, these stages connect strategic planning with implementation, performance review, and adjustments based on evidence.
What are the five principles of agile strategy execution?
The five principles covered in the course materials are adaptability, quick decision-making, access to data, enhanced collaboration, and continuous improvement. They help organizations respond to change while maintaining coordination and focus on strategic objectives.
How is agile strategy execution different from traditional strategy execution?
Agile strategy execution places particular emphasis on regular feedback, timely decisions, cross-functional collaboration, and the ability to adjust actions when conditions change. It still relies on strategic objectives, governance, resource allocation, and performance measurement. The difference is how the organization uses feedback to review implementation and make adjustments.
Does agile strategy execution mean changing the strategy frequently?
No. Agility does not require constant changes to strategic priorities. It requires a structured way to determine when evidence or changing conditions justify an adjustment. Some situations call for changes to operational activities, while others may require a review of strategic assumptions or objectives.
What is the role of KPIs in agile strategy execution?
KPIs help organizations assess progress toward strategic objectives. They provide evidence for identifying performance gaps, reviewing trends, and deciding whether further investigation or corrective action is necessary. KPIs should be linked to objectives and supported by clear definitions and reporting responsibilities.
Why is initiative management important for agile strategy execution?
Initiative management helps organizations prioritize projects and activities according to their strategic contribution, resource requirements, risks, and expected benefits. It also helps managers coordinate dependencies and redirect resources when priorities or conditions change.
How often should an organization review its strategy?
There is no single review frequency suitable for every organization. Operational issues may require weekly meetings, performance reviews may take place monthly, and strategic reviews may occur quarterly. The frequency should reflect the speed of change, the importance of the decision, and the availability of reliable information.
Can agile strategy execution work outside the IT sector?
Yes. Its principles can be applied to strategic initiatives across functions such as operations, finance, human resources, customer service, and sales. The specific methods should fit the organization’s work, governance requirements, and operating context.
What capabilities are needed for successful agile strategy execution?
Key capabilities include strategic planning, initiative and portfolio management, performance measurement, data analysis, decision-making, communication, leadership, stakeholder engagement, and change management. An organizational culture that supports collaboration, accountability, and learning is also important.
The course materials cover the strategy management framework, strategy execution prerequisites and systems, initiative management, performance measurement and reporting, adaptation to change, and the capabilities needed to support strategy execution.
*********
Editor’s Note: This guide draws on The KPI Institute’s Certified Agile Strategy Execution Professional course. The external academic references provide research context on organizational agility and strategy implementation.
A Key Performance Indicator (KPI) is a measurable expression of the achievement of a desired level of results in an area relevant to the evaluated entity’s activity. This is the definition used by The KPI Institute, a global research, training, and consultancy organization with more than 22 years of experience in performance management.
In practical terms, a KPI is a measure used to evaluate progress toward an important organizational, departmental, team, or individual objective. A KPI is not simply any number an organization can track; it is a measure selected for its relevance to a desired result and its usefulness in evaluating and improving performance.
This guide examines:
What makes a measure a KPI and how the concept is defined within The KPI Institute’s performance management framework
How KPIs differ from metrics, measures, Performance Indicators (PIs), and Key Risk Indicators (KRIs)
How KPIs operate at corporate, departmental, team, and individual levels and connect performance to organizational objectives
Why KPIs matter for clarity, focus, improvement, engagement, communication, and organizational learning
The different types of KPIs, including leading and lagging indicators, strategic and operational KPIs, and count, percentage, and monetary measures
How KPIs fit within the Balanced Scorecard and its four perspectives for measuring and managing organizational performance
How to formulate a good KPI, from defining the objective to applying SMART criteria
How the KPI lifecycle works, including the establishment, use, review, and evolution of KPIs
Practical KPI examples by department, covering finance, human resources, sales and marketing, operations, and IT and service management
Common KPI mistakes and the performance management practices that can help organizations avoid them
What Is a Key Performance Indicator (KPI)?
The most cited definition of a KPI comes from The KPI Institute. The Institute defines a KPI as “a measurable expression for the achievement of a desired level of results in an area relevant to the evaluated entity’s activity.”
Break that down and three things stand out. First, a KPI has to be measurable. Second, it points to a desired result, not just an observation. Third, it only counts if it sits in an area that matters to whoever is being measured, whether that’s a company, a department, a team, or a single employee.
A KPI is not a stand-in for “anything you can count.” Website visits, email opens, or the number of meetings held in a week are data points. They only become KPIs once they connect to a specific objective and someone acts on the result. That connection to strategy is what separates a KPI from ordinary business data, and it’s also the single most common thing organizations get wrong.
KPIs Operate at Multiple Levels
A KPI rarely stands alone. It usually sits inside a chain that runs from the boardroom down to a single desk.
Corporate level: KPIs here back strategic alignment and executive decisions. Think $ Revenue Growth or % Market Share.
Departmental level: KPIs guide functional effectiveness inside a single team, such as % On-Time Delivery in operations or % Retention Rate in HR.
Individual level: Personal KPIs connect one person’s work to the bigger goal, such as # Projects De9/3/2026Slivered On Time for a project manager.
When these three levels are built correctly, a frontline employee can trace a straight line from their own KPI to a strategic objective on the board’s scorecard. That line of sight is one of the clearest signs of a mature performance system, and its absence is one of the clearest signs of a broken one.
KPI vs. Metric vs. Measure vs. Indicator
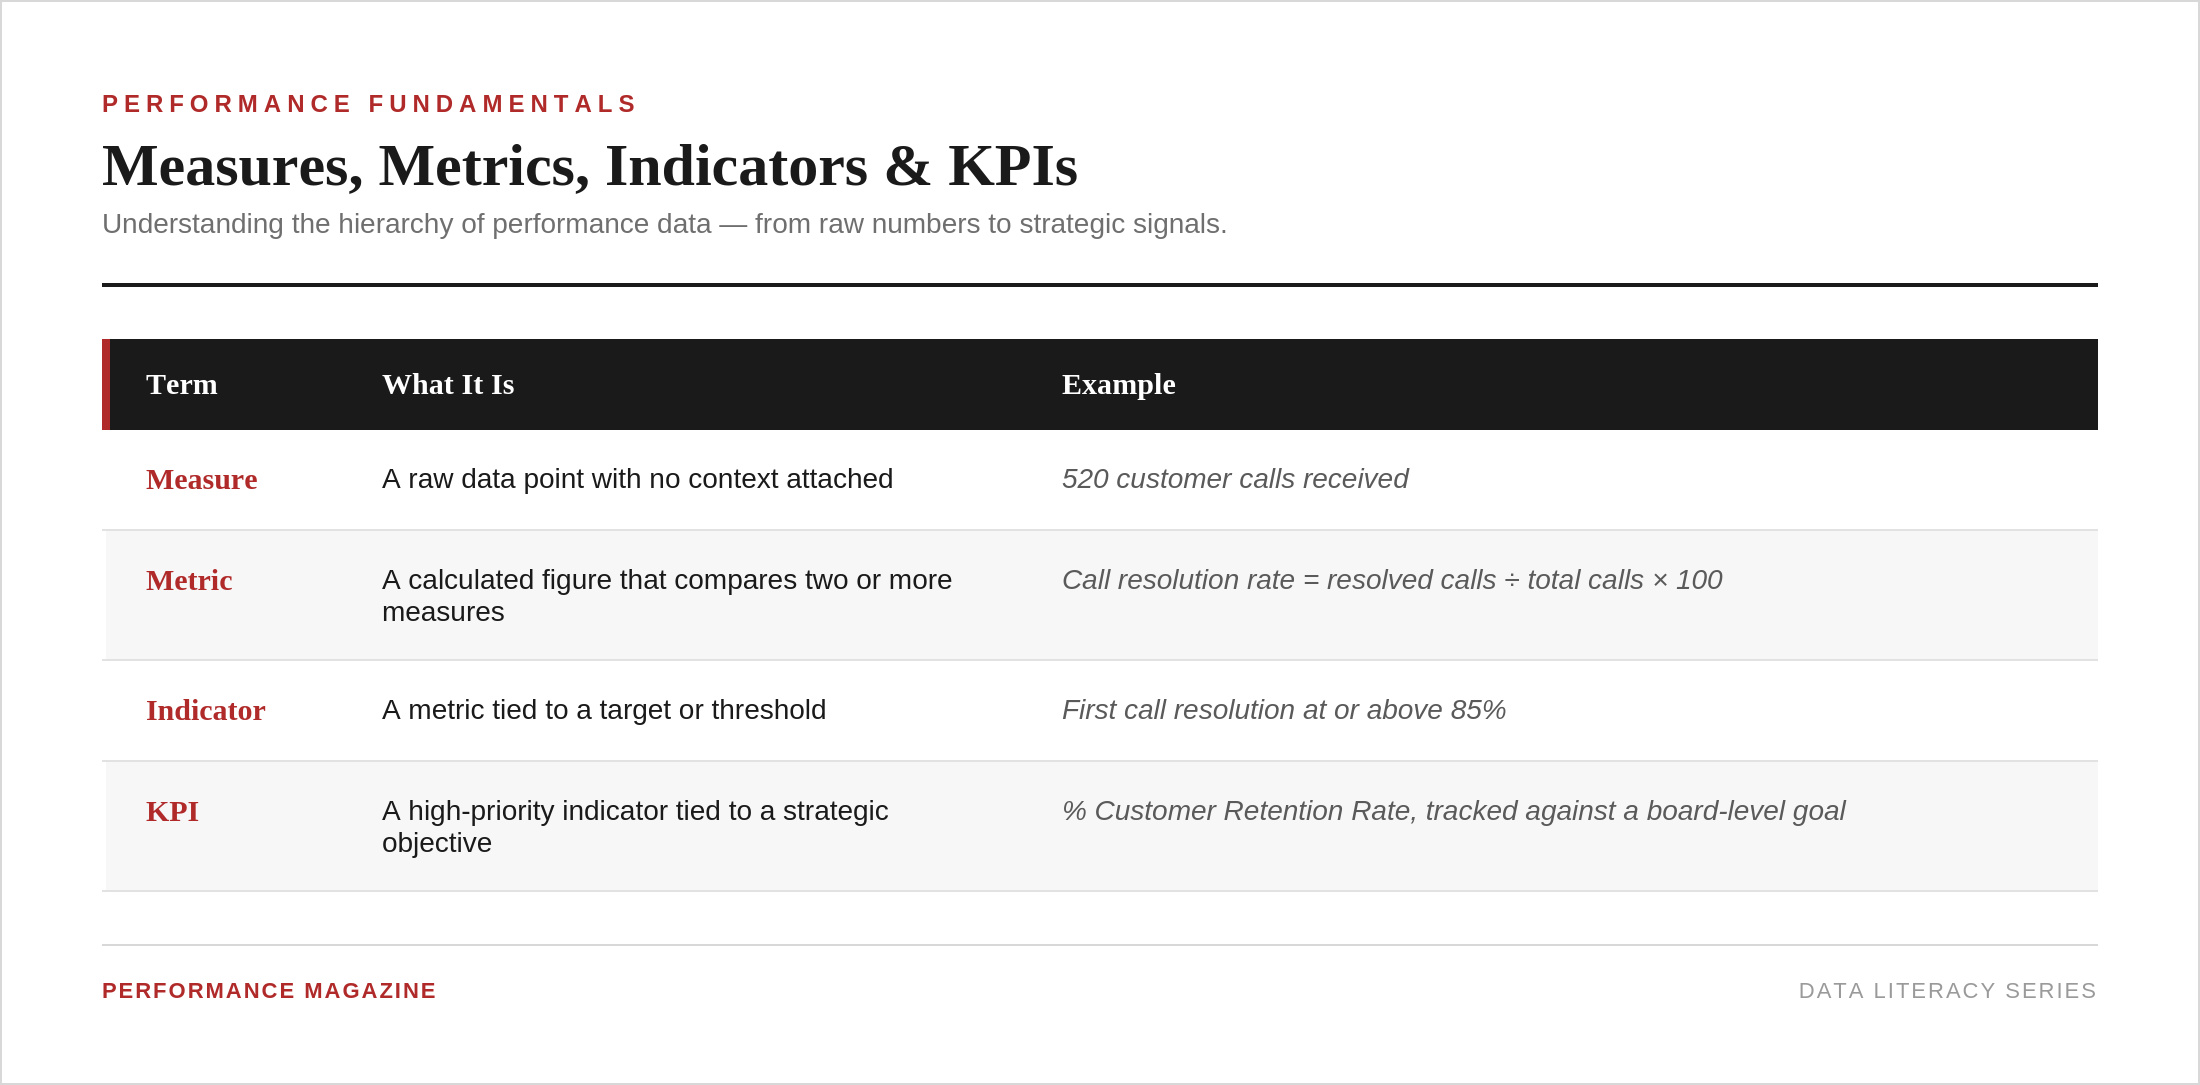
These four words get used as if they mean the same thing. They don’t, and mixing them up is one of the fastest ways to end up with a bloated, confusing dashboard.
Data moves up this chain: from raw measure, to metric, to indicator, to KPI. Most organizations track hundreds of metrics. Very few of those metrics deserve KPI status, because a KPI is reserved for the handful of numbers senior leadership actually uses to make decisions.
Where KRAs, PIs, and KRIs Fit In
The KPI Institute’s Body of Knowledge places KPIs inside a wider hierarchy of performance terms. Getting this right matters for anyone building a scorecard or a reporting structure.
Key Result Area (KRA): A broad domain where an organization has to perform well, such as Customer Experience or Operational Efficiency. A KRA is not measurable on its own; it needs indicators underneath it.
Key Performance Indicator (KPI): A high-priority, strategically significant measure tied to a KRA and reported to senior leadership.
Performance Indicator (PI): A supporting measure, relevant at the team or process level but not critical enough to reach the executive scorecard. Think # Daily Orders Processed rather than % Customer Retention Rate.
Key Risk Indicator (KRI): A forward-looking measure that flags a threat before it damages performance. Where a KPI asks “are we hitting our goals,” a KRI asks “what could stop us.”
Together, these terms form a structure that runs from strategic intent down to the data behind a single report. Companies that skip this structure tend to end up with dashboards full of numbers nobody uses.
Why KPIs Matter
A KPI is worth building only if it changes behavior. The KPI Institute’s research points to six areas where well-designed KPIs pay off.
Clarity. A KPI turns a vague ambition like “get better at customer service” into something concrete, such as % First Call Resolution. Teams stop guessing at what success looks like. Example: a retail chain that tracks $ Sales per Square Foot gets a single number that lines up real estate, merchandising, and store operations around one shared measure of location performance.
Focus. With a small set of KPIs in place, attention goes to what actually drives results instead of spreading across everything that can be counted. Example: a hospital that tracks # Average Patient Wait Time channels staff effort into the specific process fixes that shorten delays.
Improvement. A KPI trending in the wrong direction is a prompt for action, whether that means a root-cause review or a new initiative. Example: a software company watching # Issue Resolution Time climb can launch a code review process before customer satisfaction takes the hit.
Engagement. Employees who can see how their daily work moves a KPI tend to feel more ownership over the outcome than employees who only hear about targets secondhand. Example: a call center agent measured on % First Call Resolution understands their effect on customer loyalty, not just call volume.
Communication. KPIs give departments and executives a common language, which cuts down on the back-and-forth that happens when everyone reports numbers differently. Example: an ESG report built around # CO₂ Emissions per Product tells shareholders and customers a consistent story about environmental performance.
Learning. Over time, KPI trends and benchmarks become a record of what worked and what didn’t, and that record is worth more the longer an organization keeps it. Example: a marketing team reviewing a falling $ Cost per Lead across several campaigns can trace which tactics worked and repeat them.
Types of KPIs
KPIs get classified a few different ways, and it helps to know all three.
By timing. Leading indicators predict future performance (# Sales Pipeline Opportunities). Lagging indicators confirm what already happened (% Net Profit Margin). A balanced scorecard needs both, because leading indicators alone can be unreliable, and lagging indicators alone arrive too late to act on.
By scope. Strategic KPIs sit at the corporate level and matter to the board. Operational KPIs track a specific process or team, often on a weekly or monthly cycle, and roll up into the strategic picture.
By format. The KPI Institute’s naming convention tags every KPI with a symbol that signals what kind of number sits behind it:
# (count): # New Clients, # Incidents Resolved
% (rate or proportion): % Customer Satisfaction, % Employee Turnover
$ (monetary figure): $ Revenue per Employee, $ Cost per Unit
This small convention does a lot of work. Anyone who looks at a dashboard can tell at a glance whether they’re looking at a count, a rate, or a dollar figure, without reading the full label.
The Balanced Scorecard: Where Most KPIs Live
Kaplan and Norton introduced the Balanced Scorecard in a1992 Harvard Business Review article as a way to measure performance beyond financial results alone. It groups KPIs into four perspectives:
Financial: Revenue Growth Rate, Net Profit Margin, Return on Investment
Customer: Customer Satisfaction, Net Promoter Score, Customer Retention Rate
Internal Process: Process Cycle Time, Error Rate, Time to Market
People, Learning & Growth: Employee Engagement Score, Training Hours per Employee, Internal Promotion Rate
By 1996 the same framework had already expanded from measurement into strategy execution. Most modern KPI frameworks, including The KPI Institute’s own, still lean on this four-perspective structure because it forces a company to look past the income statement.
How to Write a Good KPI
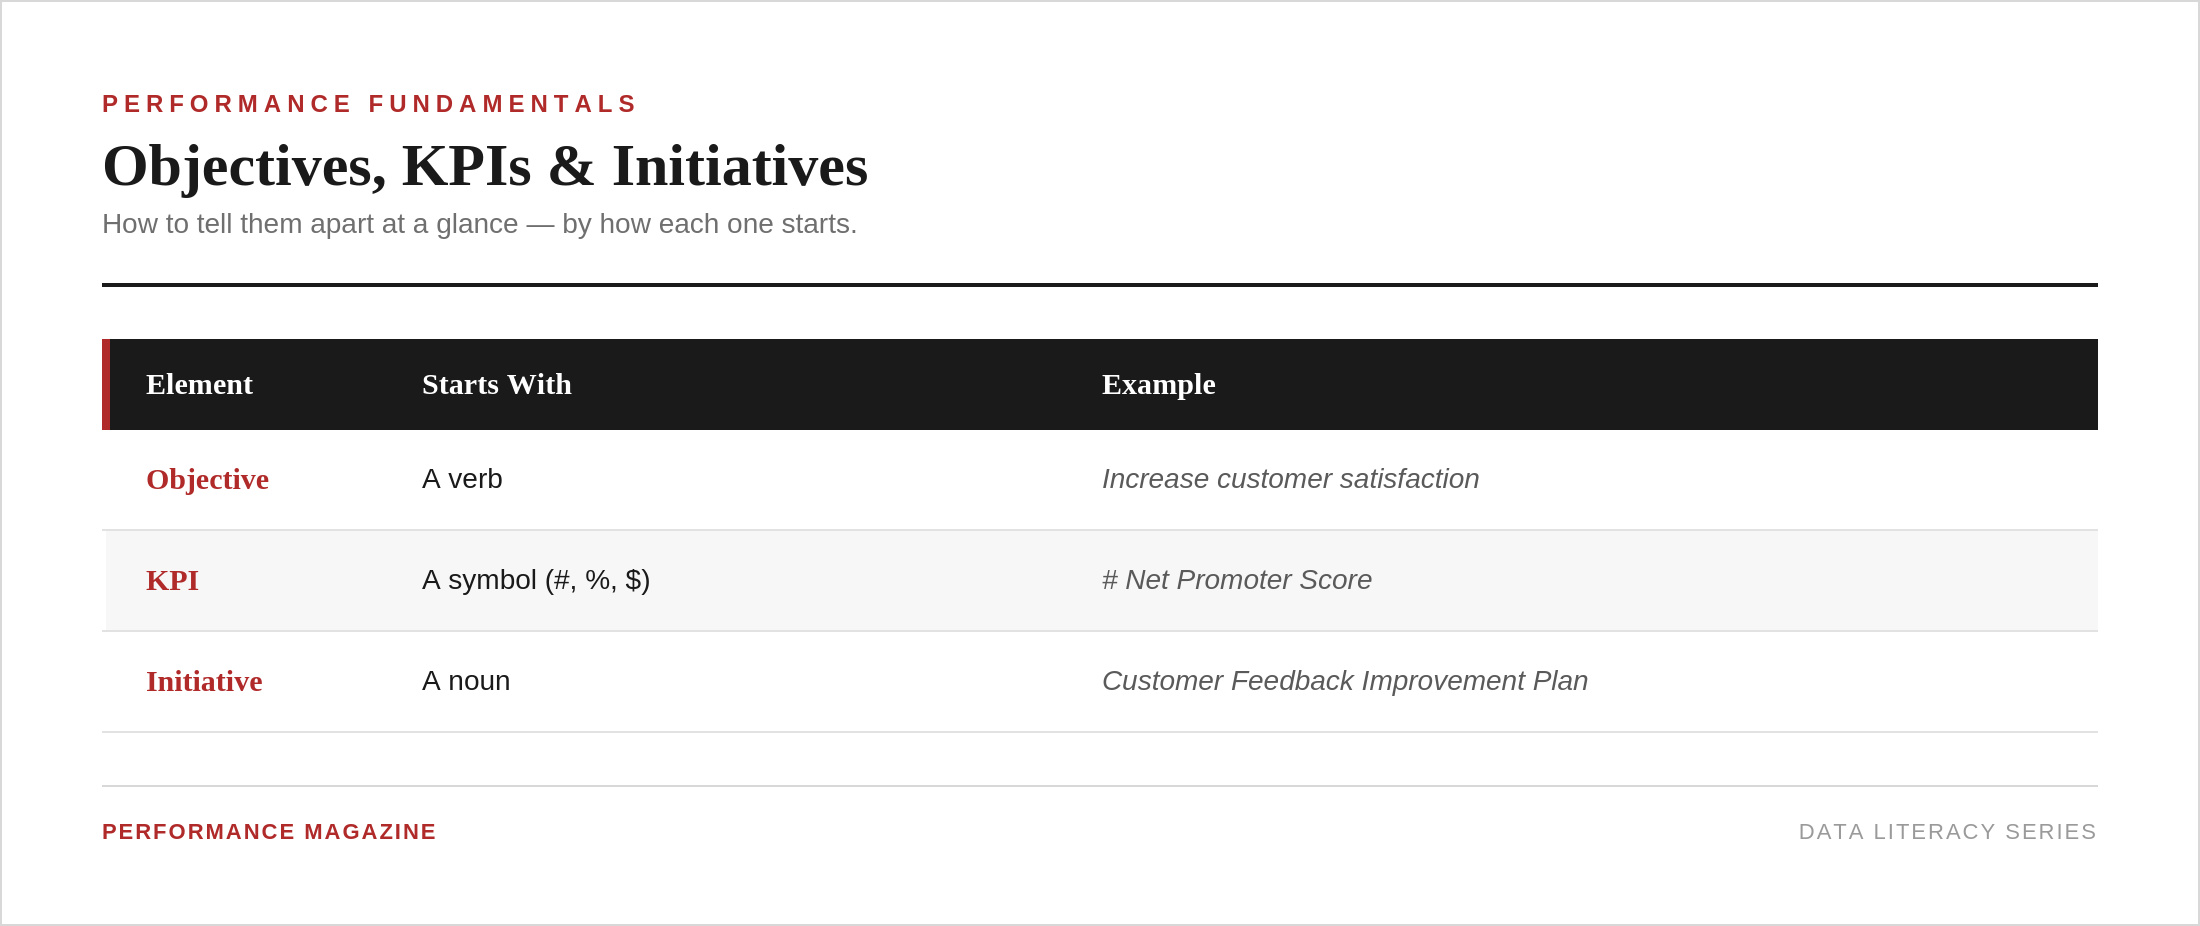
The KPI Institute recommends a consistent naming pattern that keeps objectives, KPIs, and initiatives from blurring together:
Once the objective is set, the KPI itself should meet the SMART test:
Specific: It measures one clear thing, not a vague ambition.
Measurable: The data behind it can be collected consistently.
Achievable: The target is a stretch, not a fantasy.
Relevant: It ties back to a real strategic priority, not a number that’s just easy to pull.
Time-bound: It has a reporting frequency and a deadline attached.
A KPI that fails even one of these tests tends to get ignored within a quarter.
The KPI Lifecycle
KPIs are not set-and-forget. The KPI Institute’s Body of Knowledge describes three stages every KPI moves through:
Establishment. The organization selects the KPI, documents it, and puts data collection in place.
Use. Data flows in on a regular cadence, and the KPI feeds into real decisions and reporting.
Evolution. Over time, a KPI is kept as-is, refreshed to stay relevant, suspended once it stops adding anything useful, or replaced by a more advanced measure. % Customer Satisfaction, for example, is often superseded by # Net Promoter Score as an organization matures.
Many companies skip the evolution stage, and that’s one of the most common mistakes in performance management. Plenty of organizations still track KPIs that made sense five years ago and haven’t been reviewed since.
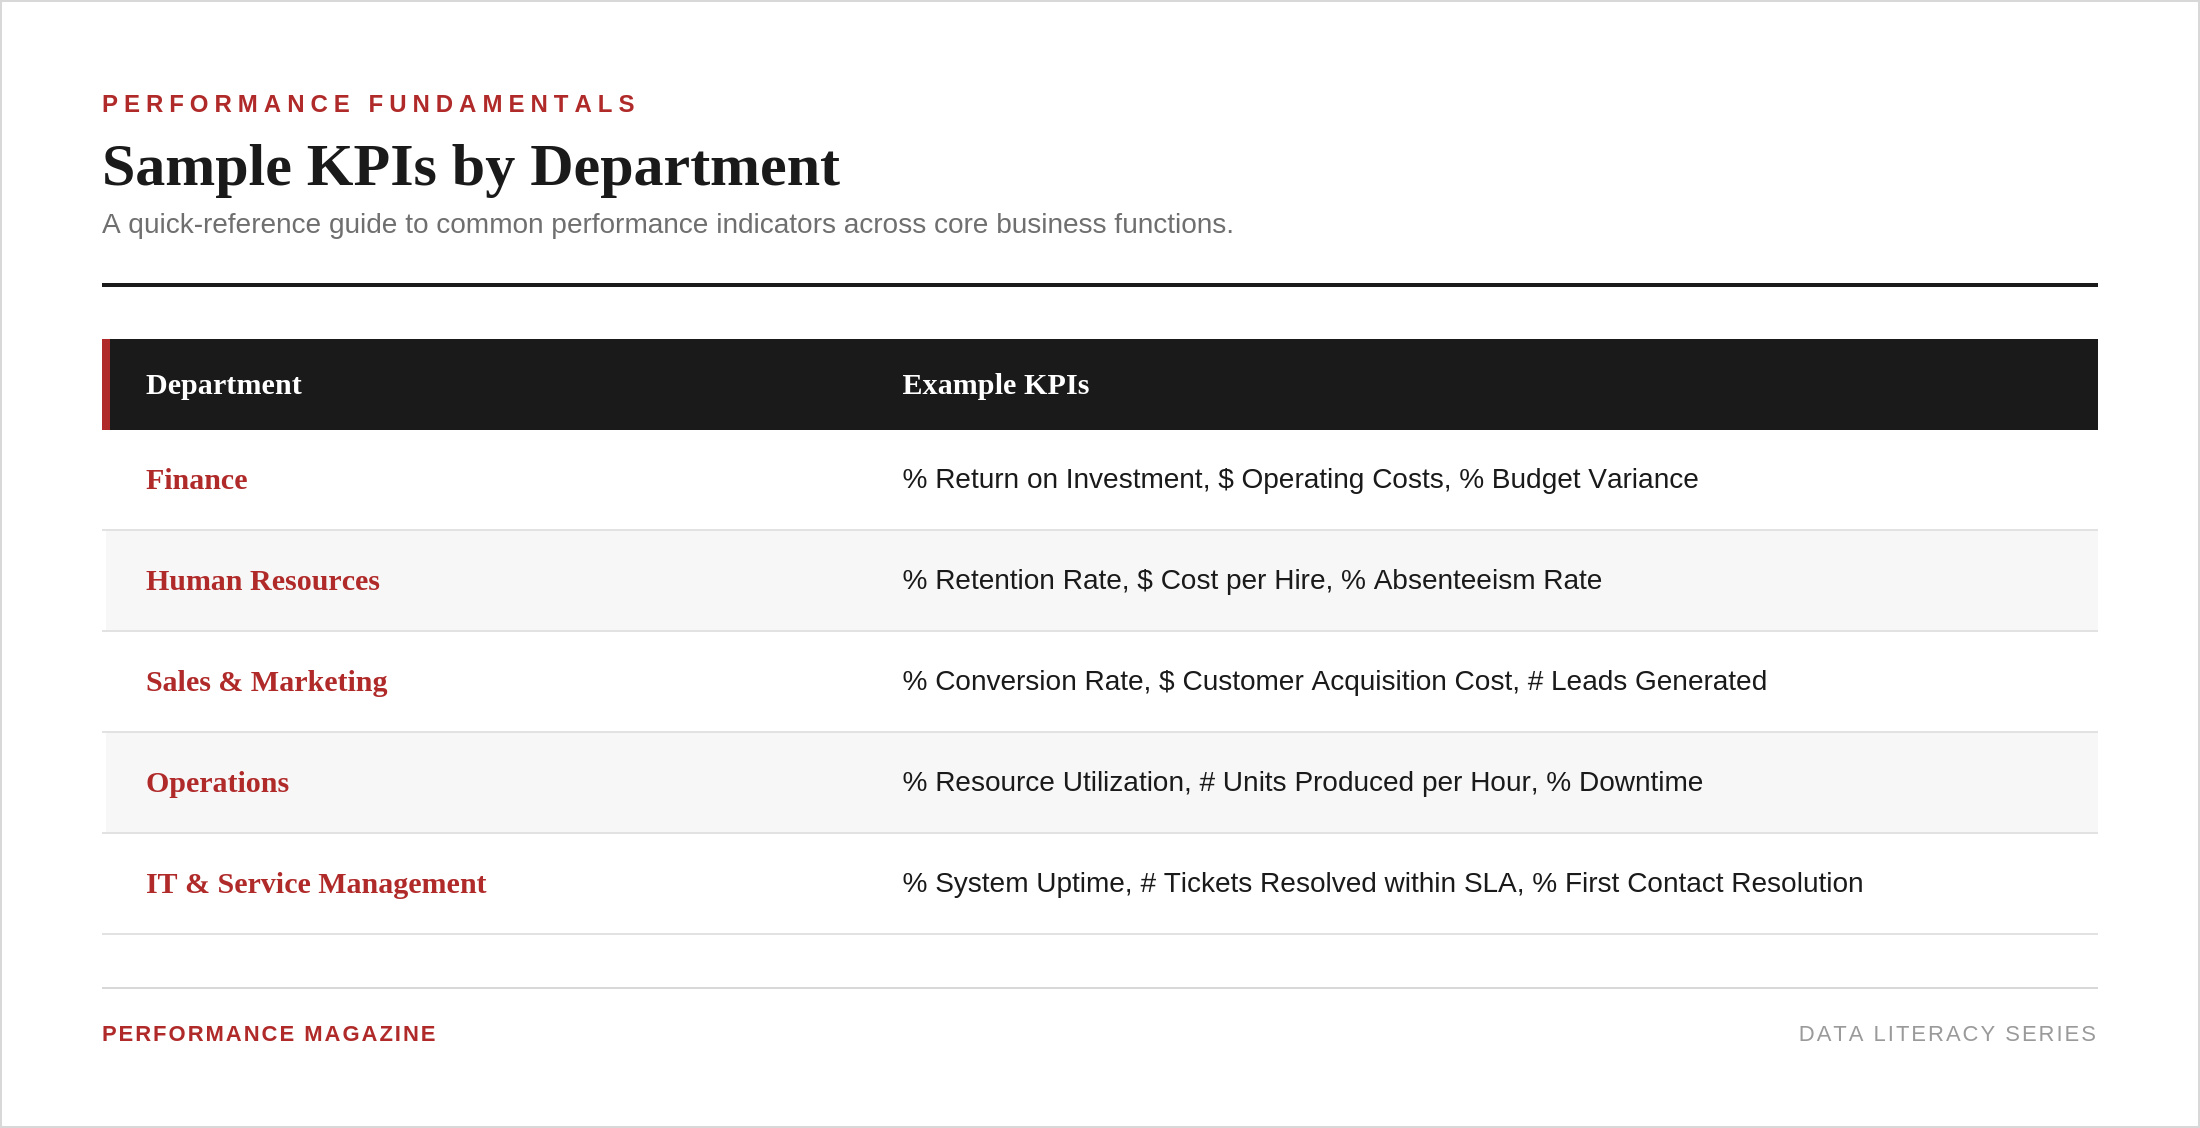
KPI Examples by Department
Most of these work best in combination rather than alone. Tracking # Tasks Completed alongside % Tasks Completed on Time and $ Value Generated per Task gives a fuller read on performance than any single number can.
Performance Measurement vs. Performance Management
These two terms get treated as synonyms, and they shouldn’t be. Neely et al. (1995) define a performance measurement system as a set of metrics used to quantify the efficiency and effectiveness of actions. Forza and Salvador (2000) go further, describing it as an information system that supports two functions: structuring communication around target setting, and collecting, processing, and delivering data on how people, processes, and business units are performing.
Performance measurement deals with the evaluation of results. Performance management deals with what happens next: the decisions, initiatives, and behavior changes built on top of that evaluation. One tracks the score. The other decides what to do about it.
The Balanced Scorecard is a good illustration of how the two ideas merge over time. Kaplan and Norton introduced it as a measurement tool in 1992. By 1996 it had grown into a strategic management system. By 2008 it sat inside a wider system for planning, execution, and organizational learning. A tool built to measure performance turned, over 16 years, into a system built to manage it.
Common KPI Mistakes
A few problems show up in nearly every organization that struggles with KPIs:
Measuring everything. Dashboards that carry 40 metrics dilute attention instead of sharpening it. A KPI list should be short enough that people remember it without looking it up.
Skipping alignment. When department KPIs aren’t linked to corporate objectives, teams end up optimizing for numbers that don’t move the business forward as a whole.
Weak documentation. A KPI without a documented formula, data source, owner, and reporting frequency is open to different interpretations by different people, and that alone can undermine trust in the number.
Stale data. A KPI that shows up weeks after the fact turns into a post-mortem rather than a tool for a live decision.
No data governance. Someone has to own data quality for each KPI, from the source system down to how often it gets refreshed. Without a named data custodian, small errors in a spreadsheet quietly turn into board-level decisions built on bad numbers.
Most of these mistakes trace back to the same root cause: a KPI system built around what’s easy to pull from an existing report, rather than what the organization actually needs to know.
Frequently Asked Questions
What does KPI stand for? KPI stands for Key Performance Indicator: a measurable value linked to a specific strategic or operational objective.
What is the difference between a KPI and a metric? A metric is any calculated figure built from raw data. A KPI is a small subset of metrics selected because it ties directly to a strategic goal and gets used by decision-makers. Every KPI is a metric, but not every metric is a KPI.
How many KPIs should an organization track? There’s no fixed number, but most performance management practitioners recommend keeping the list short, often somewhere between five and fifteen at the corporate level. More than that and the system tends to lose focus.
What makes a good KPI? A good KPI is specific, measurable, tied to a real objective, and something the organization can act on. If a KPI can’t change a decision, it’s not doing its job.
Is revenue a KPI? Revenue can be a KPI if it’s tied to a specific strategic target, such as $ Revenue Growth against a year-end goal. Without a target or an owner, it’s closer to a raw financial metric.
Who is responsible for setting KPIs in an organization? Top management sets the strategic direction and signs off on major KPIs, but the day-to-day design usually sits with a strategy or performance office, and department heads take ownership of the KPIs specific to their teams.
What is the difference between a KPI and a KRI? A KPI tracks progress toward a goal. A Key Risk Indicator (KRI) tracks the likelihood of something going wrong before it happens. Mature performance systems track both side by side.
What is the difference between a leading and a lagging KPI? A leading KPI predicts future performance, such as # Sales Pipeline Opportunities. A lagging KPI confirms a result that already happened, such as % Net Profit Margin. Leading indicators give teams time to act; lagging indicators tell them whether that action worked.
Can a KPI change over time? Yes, and it usually should. The KPI lifecycle covers exactly this: a KPI gets maintained while it’s still relevant, refreshed when its calculation needs adjusting, suspended once it stops adding anything useful, or replaced by a more advanced measure as an organization matures.
What is the difference between a KRA and a KPI? A Key Result Area (KRA) is a broad domain, such as Customer Experience or Financial Performance. It isn’t measurable by itself. A KPI is the specific, quantifiable measure placed underneath a KRA to track progress inside that domain.
Where to Go From Here
For a deeper look at any single part of KPI management, from documentation templates to lifecycle management to industry-specific examples, see:
How Can You Improve the Data Gathering Process for Your KPIs? – “An important component of performance measurement is represented by the data collection capability. However, when applied in the organizational context, this process is neither easy nor lacking obstacles, as practitioners often discover.”
How Can We Ensure Our KPIs Are Aligned With the Strategy? – “In many cases, the key performance indicators (KPIs) monitored do not seem relevant as they are not connected to the strategy. To better understand how this problem can be addressed, we must first identify its possible causes.”
How to Implement a KPI Measurement Framework – “A KPI implementation project plan provides a structure for the implementation of an organization’s performance management system. Once the project plan is set, all types of activities would have a clear deadline and designated responsibilities.”
Project Plan: Developing a Performance Management System Based on KPIs – “When formalizing and implementing a performance management system (PMS) based on key performance indicators (KPIs), there are multiple activities to be considered and many stakeholders to be engaged in the process. Therefore, you’ll need a project plan to make performance management an ongoing process within your organization.”
[Watch] KPI Selection Techniques – “Learn how KPI selection techniques can be implemented in practice and gain insights into the best practices for selecting KPIs.”
Advice on KPI Selection – “KPI selection is a process which seems simple, yet is inherently complex, due to the interdependencies involved. Here are 15 things to consider before embarking on this journey.”
[Watch] Overcoming KPI Selection Challenges: Applying KPI Selection Techniques – “What are the most important guidelines to follow when selecting KPIs for strategic objectives? What are the most efficient KPI Selection techniques, most recommended KPI selection environments, and some Value Flow Analysis technique examples?”
KPIs are not just about understanding and working with numbers. Using KPIs requires stakeholders to fulfill a vision and commit to ensuring success across all levels of their organization. If you would like to learn how to select the right KPIs for your organization, sign up for The KPI Institute’s Certified KPI Professional and Practitioner live online course today.
*********
Editor’s Note: This guide draws on The KPI Institute’s more than 20 years of research, expertise, and practical experience in performance management. Its core definitions, terminology, and frameworks are grounded in the Institute’s forthcoming KPI Body of Knowledge, developed under the leadership of Marcela Presecan, Head of Research at The KPI Institute.
In most enterprises, there is at least one, often multiple, dashboards. These glowing arrays of data, updating at lightning speed, are producing weekly reports that land in everyone’s inbox, from the CEO down to the floor supervisor.
The platforms used to gather such metrics are significant investments in configuration, and continued investment is required to extract this information and make it consumable by diverse stakeholders.
The problem is that, in many of these enterprises, the same metrics haven’t influenced a key decision for months. The underlying paradox of measurement within most of our current organizations is that the more we attempt to quantify something, the less effective we seem to become at deriving meaning and insight.
As the volume of available information proliferates, it seems increasingly challenging to discern which actions are necessary, let alone effective. Measuring for progress now seems to have morphed into measuring for mere participation.
Measurement in excess has transformed the metrics themselves into little more than participation indicators that have little to no genuine impact, when, really, you should measure only what can be measured well.
The Measurement Maximalism Trap: How Organizations Got Addicted to Data
The Dashboard That Glows But Doesn’t Guide
The dashboards originally designed for illumination, not for eye-popping designs, have become the organizational equivalent of corporate wallpaper. Visually engaging complexity, not driven to a specific action. This isn’t the flaw in the underlying technology. It’s the flaw in how you’ve defined what is worth measuring.
Today’s analytic toolset makes it easy to record virtually anything. Coupling the ease with an organization whose desire for control equals its belief in the power of more information to be that, led to the phenomenon of what you can call dashboard inflation: metrics accumulate until they crowd out the signal. When a dashboard reports 40 or 50 different metrics, there isn’t the capacity to read them deeply enough to explore anomalies and derive decisive strategic conclusions.
The organization skips and skims through. It glances over, looking for simple, overt, bright, shining red flags. Then it checks the numbers that matter and moves on. What was initially intended to drive action ends up as a task to be filed away as evidence.
The Math That Should Make Any Leader Nervous
Here’s a calculation that is great at cutting conversations short. Imagine an organization with six to ten departments or business units. Give each department an average of 8-10 KPIs to follow, which seems perfectly logical if you think about the unique needs of a single department alone.
Multiply the two, and you’re looking at 48-100 specific measurements the company is technically keeping an eye on.
Next, ask the questions that should follow:
Of all these metrics, how many are really key?
How many truly have an impact on whether or not the company is winning or losing against its highest strategic objectives?
How many exist only because someone decided back then that, since the system made them cheap and easy to generate, someone someday might even use them?
For most companies, the number of strategic indicators is considerably smaller than the hundreds one typically sees on a dashboard.
All of the others survive simply as products of inertia, and each of those hundred “key performance indicators” consumes time and brain space that should instead be devoted to the small subset of data that is truly indicative of performance.
If we had 100 “key” indicators, “key” would essentially become a meaningless word.
The “If We Can Measure It, We Should” Fallacy
The measurement maximalism trap is, at its core, a confusion between capability and wisdom. Modern data infrastructure has given organizations the ability to track almost anything in near real-time. However, capability and strategic judgment are not the same thing, and treating them as equivalent is exactly where organizations start losing the plot.
Just because something can be measured doesn’t mean it has strategic value.
Just because a platform supports 200 custom metrics doesn’t mean you need 200 metrics.
Just because data is available doesn’t mean adding it to your dashboard brings you closer to understanding your business.
What it typically brings instead is noise – an ever-growing collection of numbers that require time to maintain, energy to interpret, and attention that could otherwise go toward the things that genuinely drive performance. Gradually, the act of measurement begins to crowd out the act of improvement. Teams work harder at tracking their progress than actually making any. The organization becomes, in a very specific and avoidable way, busy without being productive.
KPI vs. PI: The Critical Distinction Most Organizations Have Forgotten
Not Every Metric Earns the Word “Key”
About 90% of what we call “KPIs” within organizations are not actually KPIs. They are PIs – performance indicators – and the difference is far more material than many admit.
A performance indicator measures something that occurs within an organization: ticket resolution times, report generation volumes, packing efficiency rates, or training completion percentages. These are all valuable numbers, certainly. They offer an operational view to the teams that own the associated processes and help them establish benchmarks for quality. Yet, they are not necessarily key.
A true KPI, used to the full potential of its name, links directly to a strategic objective.
The organization aims to increase its market share > the strategic KPI is market share.
The organization is trying to retain customers > the strategic KPI is customer retention.
It tells leadership at the highest level whether the organization is winning the game it believes it’s playing: revenue growth, net margin, profitability per customer, market share – these are the top-tier measures. Everything else is essentially noise or in service of those top-tier measures.
We have blurred the lines as organizations have grown, technology has become ubiquitous, and we’ve democratized metric-taking across teams.
It’s easy for each department or business unit to grab hold of operational metrics and dub them “KPIs” without asking whether they actually contribute to high-level organizational strategic outcomes.
Dashboards have become cluttered with PIs dressed up as strategic goals. Nobody realized they were promoted; they just sort of got there.
The 40,000-Foot View vs. Getting Lost in the Weeds So, what does a CEO actually need to know about the state of his company at any moment?
He really doesn’t care about the rate at which the warehouse packs goods unless that number affects a critical cost and/or the customer experience of the company as a whole. What he cares about are a couple of well-communicated indicators:
Is the company growing?
Is it making money?
Are customers staying?
Are we executing on the strategy we agreed we would execute upon? At that 40,000-foot level, you typically need at most six to ten really important indicators to accurately describe what’s happening. Everything else, all the departmental and operational process-level metrics, all the ratios that management needs to manage the day-to-day functions, is nobody else’s business in any of these discussions.
The weakness of measurement maximalism is, to some extent, the weakness of the hierarchy: not being able to sort and separate strategic vs operational measurements.
When you start bubbling up all the individual and departmental PIs to an organizational review meeting, the view gets blurred; the managers are going over meeting click-through rates and newsletter open rates rather than the items that are important and telling.
When KPIs Stop Driving Behaviour and Start Decorating Reports
There is a simple test that measures whether a metric warrants the label of KPI:
Does it change the way people behave?
It should detect issues early and clarify what success looks like and what’s left to do: in short, it should help teams focus.
Once a metric accomplishes these 3 things, it may deserve the “KPI” tag. When it doesn’t change behaviour or decision-making, it’s decorative.
If an organization suffers from KPI proliferation, it probably has too many decorative KPIs. Most of their metrics have gradually become decorative out of mere habit or routine report filler. They have ceased to prove anything useful. Those metrics may simply fill the gaps where data collection and reporting are requested, but without providing insights or stimulating any form of change in people’s work or behaviour. When a good KPI changes the organization’s functioning, a bad KPI or one of 50 other KPIs simply doesn’t.
Any company unable to differentiate between them faces a measurement challenge that is beyond the reach of mere dashboard adjustments.
The Real Cost of KPI Overload: Cognitive Fatigue, Decision Paralysis, and Teams That Stop Thinking
When More Data Produces Fewer Decisions
The hypothesis on which measurement maximalism operates is that more data equates to better decisions. It seems sound and scientific. It’s also quite wrong.
When executives see the dashboard, they usually don’t feel their decisions are being enhanced; the opposite generally occurs. Productivity may have increased, but consumer satisfaction has fallen. Moreover, 40 separate indicators are currently being updated simultaneously. As a result, decision makers delay while scheduling another round of meetings and trying to determine the scale of the real threat.
This is what experts call decision-making paralysis, a symptom of excessive reliance on indicators. Whenever individuals’ capacity to process additional input is overwhelmed, they automatically delay making decisions until a broader range of statistics is available. As more information is considered and more individuals are involved, the perceived uncertainty also grows, and, meanwhile, whatever issue the metrics were intended to uncover deteriorates.
The tragic reality is that these measurement frameworks, which have been used to accelerate decision-making, only lead to a stagnation of decision-making.
Hitting the Metric While Missing the Mission
Here’s a situation that illustrates the danger of mismatched KPIs more effectively than almost any theoretical statement we could make.
A company sees that its Net Promoter Score, its gauge of customer loyalty and enthusiasm, is falling. They identify a solution. Compensation and enticements are provided when feedback is being collected.
NPS rises. The number looks healthy in the next quarter’s report. The actual causes for the customers’ discontent – the friction or the failure of the product – were not, however, altered in the slightest. Many organizations develop this practice, often unwittingly, as they learn to prioritize the score rather than the outcome for which the score was originally developed.
Organizational staff who primarily gain recognition for meeting KPIs develop mechanisms to meet them.
It’s not pessimism – but rather human conduct in reaction to incentive design. Colleagues can tell which things are tested, observed, noticed, and rewarded. Individuals shift accordingly. They obtain experience in offering the appearance of efficiency, but not necessarily the efficiency itself. This is called “conquering the score while neglecting the objective” – one of the most costly forms of failing a company may encounter, since it is quite hard to spot in retrospect.
The dashboard seems all right, and values develop from the correct orientation. However, real life is slowly being corroded.
The Quiet Epidemic of Reporting Fatigue
There’s another cost of KPI saturation that doesn’t show up on any dashboard but that everyone inside organizations swimming in it can feel: the sheer time it takes to feed the beast that is the measurement system.
Getting a hundred different KPIs to tick and tock requires somebody or somebodies to collect, validate, refresh, format, and disseminate that data, frequently, sometimes weekly or monthly.
To a mid-size company, for example, those hours pile up in a hurry. Its analysts produce reports, managers pour over numbers they sort of get, and department heads struggle to fill out the same old forms with numbers only slightly different from last quarter.
That’s time spent feeding the system rather than fixing what’s broken, creating what’s needed, improving customers’ lives, helping their team develop, or making whatever executive decision they truly need to make. It’s the modern corporate bureaucracy, disguised as diligent management work. Over time, a unique, unspoken kind of demoralization seeps into these companies. The people who signed up to build things or help people come in and feel as though they’re spending an outsized fraction of their time on activities that yield little beyond raw data.
The link between their efforts and actual business outcomes begins to blur. Engagement lags persistently, subtly, maybe not to a critical degree, maybe, and not all at once, but to devastating effect down the line. The chosen metrics were designed to empower them to do more. They’re instead burning the fuel that could help them do so.
Signal-to-Noise Collapse: When Reporting Becomes the Work
Vanity Metrics and the Illusion of Progress
There’s an all-too-common disease lurking in metrics-driven workplaces: the proliferation of what could be described as “vanity metrics,” a collection of figures that make a report or a presentation look good but have little or no connection to real business performance: total hits to our website, our number of Facebook followers, the number of features we shipped this week, the amount of customer support tickets we logged, and so on.
These are all relatively easy to produce and easy to feel positive about, and, in most cases, have nothing at all to do with the really important questions like “Are we growing the right way?” or “Are customers truly getting value from what we produce?“
Vanity metrics are seductive because the directionality is right when you simply add more effort.
Your number of social followers will increase as you post more social updates. Your output quantity will increase as you produce more output. Your customer activity will rise when you do more of it. However, the link to a positive result is nonexistent.
Worse, vanity metrics muddy the waters. Genuine metrics like customer retention and the quality of outcomes you help users achieve are harder to work with than tracking output, and they rely much more on human interpretation than the former does.
It’s therefore all too easy to focus on those and neglect to measure those that might not look as good in a report but do provide far more actionable information.
The Bureaucratization of Measurement
There comes a scale at which KPI culture transforms from managing performance to compliance. It’s where measurement has become bureaucracy, full stop. You know when you’re getting there through certain signs.
Measures with no clear strategic explanation, but which were introduced into the monthly report so recently that it feels too dangerous to try to take them out again.
KPI meetings in which nothing much gets followed up afterward.
Reports that are seen, signed, stamped, and stored away.
People who know the targets they have to meet, but don’t know how they relate to anything else that the company does or wants to achieve.
As soon as measurement has begun to develop a life of its own, it loses any reason for it to have had one in the first place: to promote action that enhances performance.
Its purpose becomes simply to ensure the self-preservation of a framework for producing reports that prove reports are being produced in a seemingly organized way.
As the system appears to be very active, the system is also largely uncontested – the dashboard is refreshing, and the monthly reports are being circulated; therefore, it is clear that something is being controlled.
How Good Metrics Quietly Become Bad Incentives
The most insidious part about KPI saturation, perhaps, is what it does to our behaviour in the long run, even when the metrics were a well-intentioned effort to start with. Every single metric, the second that it’s tied to an evaluation, begins to drive behaviour. That is, after all, its job, but that’s different from improving the system the metric was designed to measure.
People get good at gaming the system to produce the number. We optimize around a specific KPI. We cut corners to hit the number. Risk-aversion increases because a miss, however minor, kills the score, and suddenly we have a workplace perfectly optimized for the appearance of performance while the real work goes unimproved.
The issue isn’t individual greed or lazy employees. It’s the predictable consequence of over-measuring and under-trusting. It seems like, by now, we’d have learned that when we tie evaluation to everything, the only smart move is to play the game, not do the work. Metrics were intended to indicate how we could improve things. In systems of over-measurement, we have replaced honest indicators with carefully managed signs of activity: noise dressed up as useful data.
From Measurement Maximalism to Measurement Intelligence: How to Build a Leaner, Smarter System
Start With the Question, Not the Dashboard
The antidote to measurement maximalism, to this idea of just measuring more and more, doesn’t actually mean “measure less for the sake of measuring less.” It means “measure with intent,” and to do that, we need to start with the most important thing, and most organizations get this part wrong more often than they get it right.
What typically happens, if you look at most organizations’ KPI frameworks and dashboards, is that they approach the creation of those frameworks based on the answer to “What’s out there for me to measure?”
Therefore, we assess what data we have, what the analytics tool can tell us, and what can fit on the dashboard, and we build the dashboard from what’s available. That feels pragmatic, and the dashboard ends up looking great, and, by and large, we’ve approached the problem backward.
The real right thing to do is actually to come back to another question: “What decision am I trying to use this metric to inform?”
If the question of what decision I’m trying to make doesn’t have a really, truly clear answer, then maybe that metric shouldn’t be on the dashboard. Maybe that KPI, that part that I’m measuring, just doesn’t belong on the dashboard unless there’s a decision tied to it, a meaningful way for me as a decision-maker to consume it.
If it’s not driving a decision for someone, it won’t serve as a helpful management tool; it will become a floating, isolated data point, and that is the real distinction between measurement intelligence and measurement maximalism. It’s not “how much do we measure” but “how focused do we measure,” which ultimately comes down to a company having more than just an objective in mind.
It should have a specific decision for every metric or set of metrics, a specific type of decision it’s going to serve, and a specific accountable owner who is expected to act as a consequence of observing the metric. If any of those three requirements are not met, perhaps that metric should be dropped.
The KPI Audit: A Framework for Cutting Without Going Blind
The practical dilemma for most people is not a lack of clarity regarding having too many KPIs; rather, it’s determining how to reduce them while maintaining visibility on the really important items. The best tool for identifying which KPIs to prune and which to keep is a system, and it does not have to be overly complicated.
For every measurement indicator on every dashboard, ask:
Does this measurement relate directly to a company’s strategic goal (the ones that really are on there)?
Does it drive a decision and prompt a quick response as the score fluctuates?
Can an informed employee explain what the measurement is tracking and why it’s important?
Would a person use this measurement to make better decisions than they otherwise would without the measure?
If the answer to any of the questions is a simple no, it means the measurement warrants significant evaluation. If you answer simply no to two or more of these questions, you could also answer simply no, since it means your measurement is unlikely to be as productive as you had initially hoped.
In addition to asking these three questions, there is a logical framework for determining how many KPIs the organization requires at different levels, which may serve as initial talking points among interested parties.
Disclaimer:The following numbers are not set in stone and are not end-all be-all guidelines; they should serve only as a starting point for a theoretical discussion on cutting down KPIs in an environment that sprouted so many of them that you don’t even know what each one tracks. They do not represent a cookie-cutter suggestion or a golden standard – they are merely the beginning of a conversation. Each company and industry is different and requires distinct efforts to maximize the use of KPIs.
For practical guidelines or a detailed plan, tailored to a specific organizational situation, get in touch with us here: https://kpiinstitute.org/contact-us
With that out of the way:
A) At the individual employee level, there is some empirical support for certain limits. Often, that revolves around the idea that one person should own no more than three KPIs at any level. If that exceeds 3, few owners can dedicate time to it, and possession skews towards fiction rather than fact.
B) At the team level, you may set up team dashboards of about ten to fifteen KPIs, as long as every measure in the dashboard is genuinely owned, assigned to a goal, and the KPIs are regularly and critically examined and are not simply noted and filed away.
C) At the organizational level, usually around no more than six to ten genuinely strategic KPIs are to be shown to executives, not out of some arbitrary constraint but out of an awareness of the cognitive limits of human beings when focusing on complex and interrelated decisions. Numbers greater than 6 – 10 make it more of a data repository than a viable system. People start focusing on quantity rather than quality.
Treat Metrics as Signals, Not Verdicts
The cultural shift that distinguishes high-performing organizations from those drowning in the metric-maximalist world is this: high-maturity organizations do not use metrics to replace judgment; they use them to inform judgment. In a KPI filled organization, metrics are always verdicts. If a metric is green, things are okay. If it’s red, someone is failing.
Teams spend their time explaining away numbers rather than understanding the system that generated them. Leaders look at averages and move forward regardless of what the averages mean; anomalies are not explored because there are too many data points to examine. In a measurement-intelligent organization, those same numbers initiate dialogue rather than conclude one. An unusual move in a metric isn’t a verdict; it’s a prompt to go deeper and inquire further, to understand what caused the movement.
Why has a number moved?
What is it signaling about the underlying system?
Is it still the thing being measured?
What action is really indicated?
Qualitative insight is as important as quantitative data, not less. The number may signal a shift, but it usually doesn’t say what to do about it. The judgments of people closest to the work, who understand the context far better than any dashboard could, are considered insights, not distractions.
Moreover, accountability in a measurement intelligence organization remains human. Decisions don’t get handed off to dashboards. They are held by humans, with dashboards as backup.
If It Doesn’t Drive a Decision, It Doesn’t Belong
The simplest reframing any organization can adopt for serious measurement culture improvements is this: a KPI that doesn’t inform a decision is not a KPI – it’s noise.
Much like writers kill their darlings when they remove words, sentences, paragraphs, or entire chapters, businesses should do the same with KPIs. Not every metric residing in your data system today will survive or should survive.
Some will be metrics that only made sense three years ago when an entirely different priority was at play. Others will be internal departmental KPIs quietly slipped into the executive dashboards. Many are vanity metrics that are too vain to keep. Pruning these will enable you to stop operating blind and start to see clearly for the first time in what feels like a long time.
Final Thoughts
Measurement is not evil.
Measuring things up is a response that makes complete sense – that impulse to understand if whatever you are up to is actually happening, to detect what might soon become an acute problem, to gauge what may be a slept-on trend, and to want to hold people to account for results.
Yet, when measurement takes on a life of its own, it seems more crucial to do measurement for its own sake. Dashboards become more of a concern than just tools that support decision-making. Teams devote so much effort to feeding some form of measurement tool to demonstrate progress toward the desired end that the effort shifts away from running the business to the business of measuring the business.
Metrics are powerful tools. Used with intention, they drive the kind of accountability that genuinely changes things. However, they are terrible masters, and the organizations that remember the difference (that keep humans in charge of judgment while using data to sharpen it) are the ones that turn performance measurement into a real competitive advantage.
Measure less to understand more to decide better.
**********
Looking to strengthen your expertise in KPI design and performance measurement? Gain practical knowledge, proven methodologies, and globally recognized certification through The KPI Institute’s Online Certified KPI Professional.
Modern organizations are obsessed with measurement. Pop into virtually any executive meeting, and you’re likely to find glowing dashboards, reports, infographics, charts, and scorecards packed with performance metrics.
Revenue growth, customer satisfaction, engagement, productivity, utilization, retention, cycle time: if it can be quantified, it’s probably being tracked.
This is the Official Market, or what organizations buy and sell in an attempt to take the inherent complexity of business and turn it into something understandable: reports, scorecards, dashboards, intelligence platforms, and Balanced Scorecards.
Business needs complexity to transform into something manageable. Leadership must see into what happens everywhere in the organization, and metrics give teams a common language to express how they perform. Formal metrics are the right tool for holding employees accountable and for allowing leaders to assess the performance of individuals or teams against others over time.
Yet the potential harms of overreliance on formal measurement systems aren’t merely abstract or as far-fetched as many make them out to be.
Natlia Cuguer-Escofet, a researcher at the University of Pompeu Fabra, and Josep M. Rosanas at Universitat de Barcelona analyzed a set of cases in which performance management systems, when implemented rigidly, led to unintended outcomes, including cases from Spanish banks in the period leading up to the 2008 crisis.
In one such instance, a manager who was resistant to escalating loan-making practices was moved out of a position where loan decisions could be made, despite being given a promotion (in the form of an increased salary and improved office space).
In another instance, a board member who was hesitant about an asset’s value was reluctant to express his reservations because the organization’s incentive systems largely tied everyone’s performance to profit. The performance systems were working as they were designed to, but their output was discouraging decision-makers from making professional decisions when they were most needed.
The takeaway from these scenarios isn’t that measurement is itself flawed; it’s that every organization’s performance system will eventually hit a ceiling where it can’t foresee every contingency. When they become overly committed to using objective indicators, organizations risk inhibiting the human intelligence that might warn them of a problem before it shows up in the results.
The crux of the problem isn’t so much a reliance on measuring performance; it’s the assumption that measurable equals significant.
Organizations are often obsessed with measuring metrics, even though those same metrics sometimes do not truly matter to an organization’s success. These metrics aren’t designed to provide a clear picture of why something is or isn’t working; rather, they simply demonstrate what is going on.
They aren’t about showing how frustrated customers are; instead, they show that the satisfaction level has fallen. They aren’t about the employee turnover going up but about what has led to employee discontentment over time. An organization’s ability to identify the causes of declining numbers is critically important, yet metrics cannot illustrate the complexities driving performance from the bottom up.
This weakness is exacerbated, in many cases, by the fact that metrics are, by their very nature, selective. Each KPI necessarily prioritizes some aspects of performance while overlooking others. Organizations use metrics to measure performance based on what they perceive as critical, yet the business environment and consumer expectations require new perspectives. The KPIs organizations rely on may therefore cease to align with the reality on the ground.
It is simply a matter of fact that metrics are better indicators than drivers. When the system measures certain behaviours and outcomes, employees quickly adapt by doing what the system wants them to do. When employees are measured on customer service call time, for example, they learn to hang up with customers as quickly as possible rather than solve their problem. Metrics lead us to manipulate an organization’s output through what we measure, even if what we measure isn’t indicative of success.
“The problem isn’t a measurement one; it’s a knowledge one. You can know the velocity; you just don’t know where you’re headed, and therefore you just don’t know what to do, which makes managing impossible.” – Jeff Bezos
This system of performance relies upon measurement for decision and action-taking but neglects the human aspect; instead, it relies on information that is already visible or reportable. The challenge is that all of this is usually evident on a dashboard if it is tracked or measured.
With that said, not all aspects of the performance in the workplace are quantifiable:
Trust is hard to measure
Honesty cannot be quantified
Creativity or foresight doesn’t have to be demonstrated on a chart
These are not all reflected in The Official Market, as every metric, KPI, report or business scorecard makes choices about what’s relevant and what isn’t.
Sadly, by focusing solely on what we can readily identify as critical and important, many organizations inadvertently start to devalue or even ignore areas they cannot easily quantify. That, it has been said, means the information in their reporting systems may be missing valuable pieces or even be flat-out misleading.
One example is a business intelligence system that tells people how busy employees were in the office (measured by time spent at the desk, use of specific tools, etc.) but does not measure the outcomes of that work. This system has become completely removed from the actual outcomes that would determine whether employees were actually working effectively or not.
In such instances, organizations become overly dependent on such formally measured criteria and risk suppressing human judgment or observation that would otherwise point them toward a problem early on.
The Black Market
There’s one in every organization.
It might not show up in your year-end results. It might not be mentioned in a quarterly review. It definitely will not be in your executive dashboard, but nearly everyone in the company knows it.
This is the KPI Black Market; this is where you would go when your formal measures do not tell the same story. The name is controversial, but it should not be when people search for additional data to navigate a complex business. If an organization goes to great lengths, many beneficial ideas may fall outside measurement standards.
The Conversations That Never Make the Dashboard
Companies have invested significant resources over the past few years in business intelligence tools that afford a live view of operations. However, much of an organization’s most useful intelligence still travels via conversation.
A sales leader hears multiple account managers mention the same customer pain point.
A product leader notices an increase in “what is that for?” type questions about a new feature.
A team lead finds conversation in their team’s hushed post-all-hands meeting.
A customer success manager starts hearing unusually similar wording in otherwise unrelated client calls, hinting at a shared frustration that hasn’t been logged anywhere yet.
A regional manager notices that high performers are suddenly asking more “confirmation” questions instead of making autonomous decisions.
A project lead observes that status updates remain technically positive, but the tone of delivery shifts: shorter messages, fewer details, less narrative confidence.
An HR partner hears recurring “soft exits” in development conversations – people talking more about uncertainty, optionality, or “keeping an eye on things” rather than commitment.
Those aren’t standard metrics, but they often show trouble before it hits the Profit & Loss (P&L).
That’s partly why leaders place so much importance on informal conversation – it’s where emerging signals like doubt, disappointment, enthusiasm, and apprehension get aired while they’re still in their most formative (and useful) stage.
Once a signal is a metric, it’s already past the critical inflection point. That is due to the fact that dashboards chronicle what happened, while conversations signal what’s about to happen.
We write down and archive at an unforeseen speed, yet much of our knowledge is often contained…elsewhere. That knowledge often moves through the Black Market, with almost blinding celerity.
The Mental Dashboard
Try asking an experienced sales leader what will make the quarter miss your target. They often start with “I have a feeling.” It’s the kind of thing a data scientist will probably break out maniacally in a feverish rash at the sound of it.
How can they predict they might miss when the company invests millions in data and analytics to give you objectivity?!
However, the data science in judgment and forecasting actually supports this kind of intuitive forecasting: experts use intuition often not at random but rather to detect patterns that may not show up explicitly and may even be unable to be easily and systematically articulated, due to experience (e.g., having interacted with customers, products, markets, negotiations, and company stakeholders), which can be more sensitive to some cues than others.
You might experience it as a feeling or a sense:
A salesperson feeling the heat because customer engagement seems “off” but has not yet been captured by metrics.
A regional manager in your organization who believes they sense unusual nervousness in the sales reps during customer interactions.
Customer success may note that the typical post-demo and pilot behaviour among clients has changed slightly, but it is not yet affecting metrics such as engagement and churn. In these kinds of instances, they are not officially being recognized by your data platform.
Yet these sorts of signals often influence forecast judgments, however indirectly. Leaders, in essence, operate with two dashboards: one that they see on their screen and another that resides in their head.
One is evidence of what is happening. The other is the interpretation of what’s happening. Neither works well without the other.
The Spreadsheet Nobody Talks About
Perhaps one of the most unaddressed elements of organizational life is the presence of shadow forecasting mechanisms.
Officially, there’s an organization’s forecast. Unofficially, there often exists a second forecast, which may exist in the form of an individual’s private spreadsheet, in an individual’s notebook, or through individual or team discussion.
It is likely, in some form, that this meeting has been heard in every organization where one exists.
The company forecast is presented.
The numbers look perfectly healthy.
Then inevitably someone pipes up, “OK, but what do we actually think?”
The line dividing the Official and Black markets is drawn with that phrase. The Official forecast might be the organization’s most formal assessment, but the Black Market forecast often represents a compilation of individual experience, customer issues, the news and anything else that doesn’t easily lend itself to tabulation.
It’s curious that shadow forecasts don’t necessarily always compete directly against official outputs. Indeed, they can arise as employees try to circumvent gaps they see in the official mechanisms. The fact of there being a spreadsheet doesn’t necessarily matter, since it is the quest for a depiction of reality that people believe in.
Tribal Knowledge and Unofficial Indicators
Arguably the hottest currency in the KPI Black Market is tribe experience. Most organizations have individuals who seem to be aware of certain things well before the rest of the population becomes aware of them. Those individuals understand which projects are real and which generate polished-looking status charts. They can usually predict the top truly unserved and unhappy customer base even before official complaints surface.
Such employees know which operational hazards warrant attention, even when they do not appear in risk analyses. What’s truly fascinating is that these fellows often don’t even have access to data; however, they have contextual gut feelings. By virtue of experience or informed hunches, they understand and see patterns that systems simply can’t capture.
These people remember what happened last time. They recall the anger, the shouts, the boasts, the merriment, or the frustration. They are living archives, in a sense. As such, organizations often defer significantly to individuals who cannot effectively translate the value of their insights into metrics, yet that value is very much there.
This then creates an interesting paradox.
On the one hand, companies may champion objectivity; on the other hand, in uncertain environments, they often turn to sources of experience who, by their nature, are not subject to objective measurement systems. Similar principles are evidenced in how folks make decisions in the informal universe on a day-to-day basis.
Managers observe how quickly answers are transmitted for questions and inquiries.
Account teams pick up on the customer’s emotional tone rather than on official customer satisfaction reports.
Product team leaders keep their eyes on the number of surprises.
Executive team members will note when the “unhappy camper” stops raising their objections.
These signals often aren’t included on charts but have a tremendous impact on decision-making, at times having a significantly greater impact than the official scores themselves.
Why the Black Market Exists
It may be tempting to see these informal arrangements as proof of the ultimate failure of formal measurement. This is a faulty assumption that relies on a complete misunderstanding of the very premise. The existence of the KPI Black Market signals that organizations are, ultimately, human systems operating in contexts far more complex than can ever be fully captured by numbers.
Dashboards cannot account for every variable. KPIs cannot enumerate every risk. Reports cannot portray trust, morale, judgment, intuition, confidence, or culture. When people and groups try to find order in increasingly chaotic surroundings, it is natural that they create complementary information systems – the KPI Black Market – that support and backstop formal systems. The KPI Black Market is thus not a conspiracy against data, but a very reasonable response to its ultimate shortcomings. It is a natural evolution of a most logical process.
Perhaps the most important irony is that most organizations already rely upon the inputs of this unrecorded channel: they simply do so informally and under the table.
The highest-trusted and most timely signals usually originate elsewhere – between peers, during hallway discussions, through personal observation, or based on embodied tacit knowledge. The KPI Black Market is more prevalent in complex environments where reality is perennially richer than our metrics, and, more generally, in organizations that have simply done too poor a job of creating formal indicators.
What Should Leaders Do About the KPI Black Market?
The existence of the KPI Black Market does not, of course, suggest that companies should discard their dashboards, scorecards, or formal reports. Au contraire!
Formal measurement is crucial if organizational performance is to be consistent and comparable, and if accountability is to be meaningful rather than arbitrary, and so much so that the Official Market is an essential part of organizational life.
The problem isn’t that organizations formally measure performance; it’s that they treat formal measurements as complete representations of reality rather than partial ones.
Great leaders recognize that the best dashboard or scorecard cannot do their thinking for them, but can help them think, and that, in addition to the question “What does this metric say?”, a second question needs to be asked.
“What’s missing from this metric?”
A necessary shift in focus leads to the treatment of signals and the observations of employees as information & value, not noise. The aim here isn’t the wholesale abandonment of measurement, but the supplementation of metrics by insight.
A similar approach can be found in the management literature, and the argument has long been made that formal management controls necessarily contain gaps that must be filled by managerial judgment, a concept of “informal justice”.
In essence, such judgments may allow us to question the validity of a metric because it has not kept pace with changing circumstances. Perhaps the easiest way in which to undertake a measure of diagnosis is for a team of leaders to take the time to ask management to list all of the things that management considers important, and then see what doesn’t appear on the board.
Final Thoughts
It is increasingly common to portray organizations as rational, analytical, almost-organic beings in which decisions are data-driven, and metrics are king.
To a certain extent, this is true. Most of them are, indeed, social entities – powered by the experience, intuition, confidence, and understanding coming from their members. Such a sentiment would be historically true as well, as it was the case well before dashboards existed – managers trusted their intuition and vision. Long before business intelligence platforms were born, people discussed and understood their environment to proceed forward, even when uncertainty loomed like an overcast sky.
Although our reporting tools now offer unprecedented visibility, this doesn’t deny the need for those implicit ways of leading teams to progress. Frankly speaking, they simply shouldn’t impede this.
It would be a naive mistake to assume all critical variables can be measured, as the key predictors of an organization’s success are sometimes elusive to quantification. These signals originate from talks, gut feelings, interactions, observations, and events, which never exactly translate onto a metric dashboard.
However, leading companies leverage both, sometimes in equal measure, and often to great success. A dashboard illustrates the past, while those close to the business can provide current-state insights and often foresight.
This is the key takeaway one should derive from the KPI Black Market. The real value is found where the most trustworthy predictors remain off the official dashboard.
**********
Looking to strengthen your expertise in KPI design and performance measurement? Gain practical knowledge, proven methodologies, and globally recognized certification through The KPI Institute’s Online Certified KPI Professional.