
Data Analytics Framework: 5 Steps to Set Goals and Create High-Performance KPI Dashboards

Image Source – Freepik
The term “high-performance” implies that the team’s performance is measured and either meets or exceeds expectations. Thus, for organizations seeking objective measurement and the precision necessary for informed decision-making, having a strong data analytics framework is indispensable. One of the most practical applications of this is the use of key performance indicators (KPI) dashboards to track progress and align efforts.
Before developing a KPI dashboard, it is important for organizations to first understand how goals are set, including the processes, roles, and considerations involved, as these form the foundation for effective measurement and improvement.
Analytical Goal Setting
Step 1: Defining High Performance
The first step to achieving high performance is to define it. This is done by setting specific objectives for your company, team, and team members. This process is usually top-down for most businesses, meaning top management defines the company-wide goals first and then cascades them down the totem pole.
Let’s take a small marketing consultancy firm as an example. The firm’s top management may define high performance as achieving a 10% year-over-year growth in revenue. Achieving this target means the company is high-performing.
Step 2: Identifying Key Processes
At this point, everyone in the company should already understand what management sees as high performance. However, what does high performance mean for individual teams? They must understand what they can specifically do to help the company achieve high performance.
Let’s continue with our marketing consultancy example. If the company aims to achieve 10% year-over-year growth in revenue, here is how each department can contribute to this goal.
- The marketing team can work on increasing the number of generated leads.
- The sales team might implement new strategies to upsell current and old clients. They can also train the salespeople to increase the conversion rate of leads into customers.
- The finance team can collect invoices from customers faster, leading to higher reported revenue and lower bad debt.
- The client services team can work on increasing customer satisfaction, therefore retaining clients for longer.
If every team member understands which of the processes they can influence, then they can all work together to achieve high performance. This clarity around goals and processes forms a critical part of the overall data analytics framework, ensuring that every metric tracked later truly reflects business priorities.
Read More >> How KPIs Add Value to Big Data Visualization
Step 3: Planning Specific Improvements
It can be tempting to set targets for each team member related to every process. However, achieving high performance does not come from setting aggressive targets alone. This is something that Richard Rumelt talks about in his book Good Strategy/Bad Strategy. In the book, he states that growth targets should be justified by:
- A wider industry growth
- A new product/service that a company launches
- An improvement in a current business process
- New source of leads
For example, before the sales team commits to a 10% year-over-year increase in sales to existing clients, management should decide what exactly will contribute to this growth:
- Is this in line with the wider industry trend? If so, management should define specific strategies for how the sales team could capitalize on it.
- Did the company launch a new product? If so, management can work together with the sales team to identify new upsell opportunities.
- Does the sales team need more capacity for the sales process? If so, management can hire an additional salesperson.
- Are there any salespeople who have better conversion rates than others? If so, management can train the other salespeople based on the best practices of high achievers.
Essentially, the whole team needs to agree on what specifically would drive business growth. Once this is done, management will be able to identify specific tasks and start assigning them to team members.
Data Analytics
Step 4: Determining KPIs
Once the process is identified and broken down into tasks, there are two types of key performance indicators (KPIs) that the team needs to measure:
- How tasks are being completed
- The output of the process
For example, here are the KPIs that measure how effectively the sales team is following the process:
- # Prospecting calls to existing clients per month
- % Clients contacted with new offers
- # Demos to existing clients
Measuring and tracking the team’s performance based on these KPIs can help identify any potential problems in the execution process.
The company should also identify KPIs that measure whether the new process is productive, such as:
- # Sales closed
- $ Additional revenue
- % Conversion rate from prospecting calls to demos
These KPIs can help the company understand if the process is bringing the desired results to the business. If not, the company may need to re-engineer the process or pivot toward a different one altogether.
The final step is to set targets based on every KPI. This will set performance expectations for every team member and ensure clarity on how their performance is measured.
Step 5: Developing KPI Dashboards
KPI dashboards help management keep their finger on the pulse of the company by providing the latest updates based on identified KPIs. The process of building these KPI dashboards involves:
- Extracting the data needed to calculate these KPIs
- Visualizing this data by using business intelligence (BI) services like Power BI or Tableau
- Refreshing the data in these dashboards either manually or automatically
Using BI tools to build KPI dashboards enables businesses to automate their reporting process, which makes it easy to refresh the dashboards every day. By having almost real-time reporting, management can quickly identify if the process needs to be optimized and which part of the process is responsible for underperformance.
For example, the CRM KPI dashboard (see Figure 1) analyzes the performance of every sales representative within a team based on their activity metrics. Notice how there are targets for every sales activity KPI and for each team member.
![]()
![]()
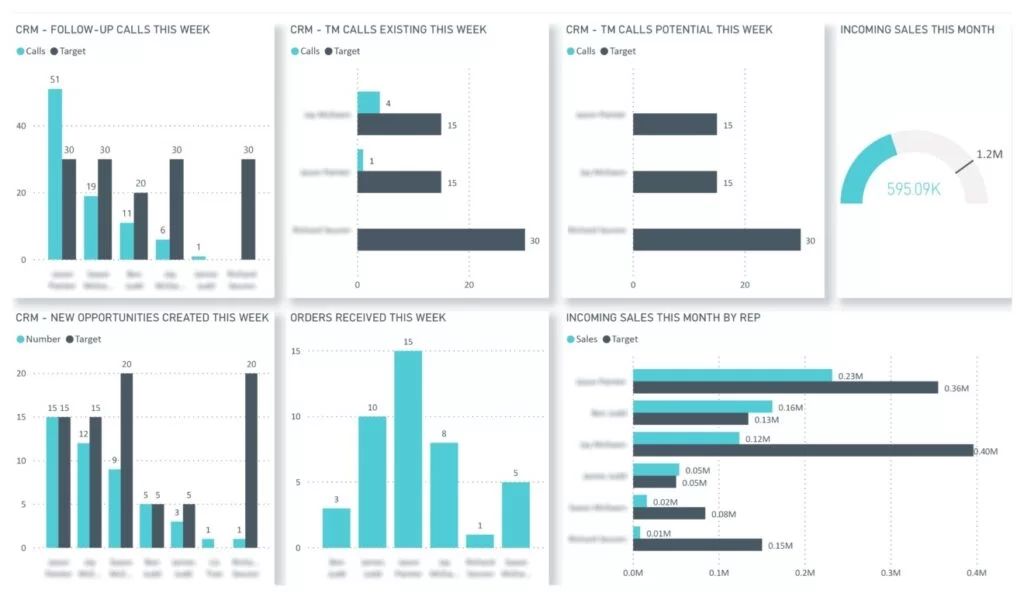
Figure 1. CRM KPI Dashboard – Source Vidi Corp
Many companies also choose to share these KPI dashboards with every team member so that everyone knows their performance and how it compares with others in the team.
Sharing KPI dashboards with the whole team is impactful for several reasons:
- Every employee understands which KPIs are used to measure their performance.
- Everyone is clear at all times whether they are on track to hit their targets.
- Team managers can identify high performers and team members who need the most help.
Compassionate Management
However, creating data analytics reports alone is not going to drive high performance. Data analytics reports simply improve the management of business processes, which can lead to higher performance.
It is also important to note that working to achieve certain targets can be quite stressful for the team. A good practice is for management to take a helpful stance on achieving targets by supporting team members when they need it, instead of putting more pressure on them when their performance lags.
**********
Editor’s Note: This article was written by Eugene Lebedev, managing director of Vidi Corp, a UK-based data analytics consultancy. He has delivered over 1000 data analytics solutions for more than 600 international clients, including Google, Teleperformance, and Delta Air Lines.
