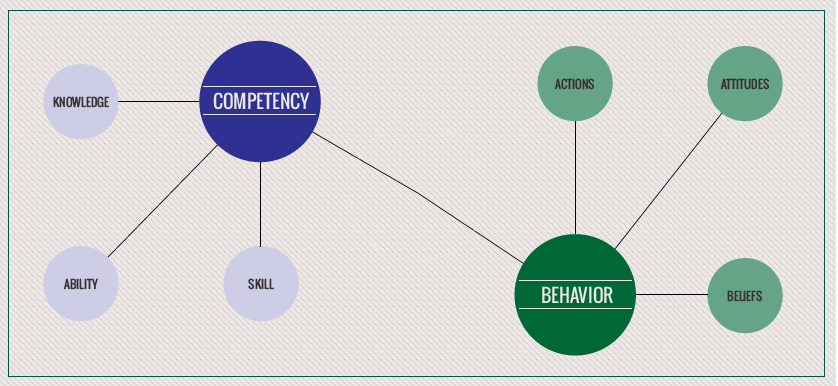
Competencies and behaviors are different concepts, yet one can influence the other and vice-versa. However, they are to be analyzed separately when they represent decisional factors for an employee’s performance.
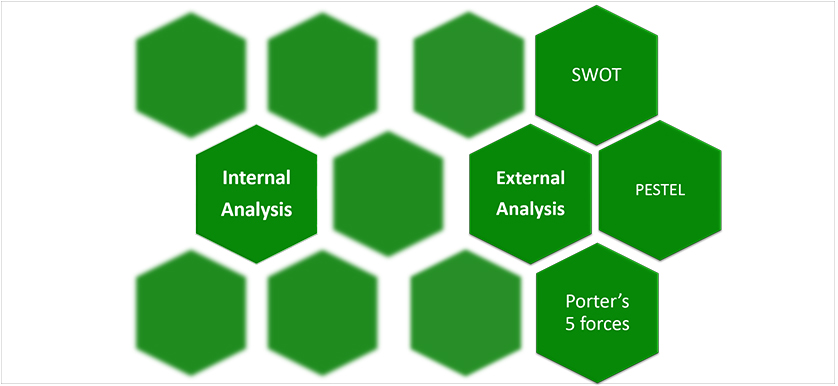
Every company has a strategy regarding the objectives they want to achieve, but the difference between a successful and an unsuccessful strategy lies in the steps that are taken when formulating the strategy, more specifically in the first step, the external analysis. In order to facilitate this process, organizations can deploy a number of tools to perform an external analysis thoroughly.
1. SWOT
It is an acronym for Strengths, Weaknesses, Opportunities and Threats. Strengths and Weaknesses are used for the internal scan of the company, while Opportunities and Threats are part of the external scan. By analyzing the external environment, the company can better focus its internal resources to reduce the threats and capitalize on its opportunities.
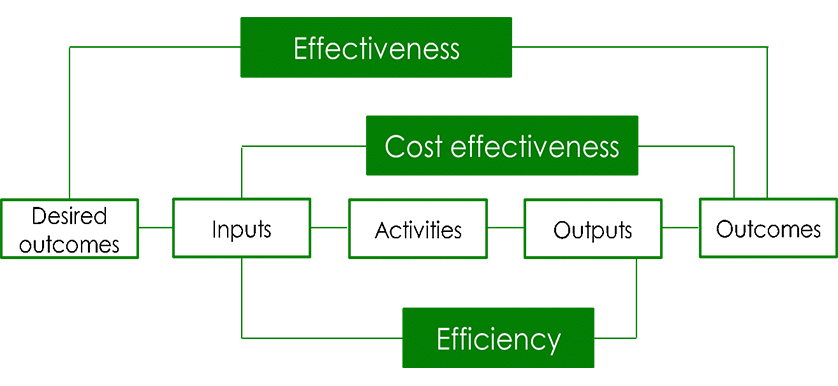
The Value Flow Analysis (VFA) represents a Key Performance Indicators (KPIs) selection technique, focused on analyzing the value generated by a system at all stages: Input, Process, Output and Outcome. This technique is mostly used during the KPI selection workshop, in order to properly measure the value generated within each stage. For each objective, KPIs are selected for Input, Process, Output and Outcome. Based on this initial listing, the KPIs that best reflect the achievement of the objective are selected.
Data visualization is, roughly, the visual representation of information. From business executives and managers to business analysts or operations/manufacturing/supply chain managers, they all use charts, tables, histograms of other types of graphics to better visualize their data. Bar charts, line charts, scatter graphs and maps are simple examples of data visualization that have been used for decades.
While activating in a company, employees attend several training programs, which can be general or specific in nature. Even if a training is general, specific, technical or targets soft skills development, it can be either truly helpful or insignificant for the same employees, all this depending on the future actions taken.