Storytelling with KPIs: Going beyond insights by delivering impact

From the dawn of time, humans have told stories. Why? Because they are easily relatable. Stories help us easily understand complex situations in engaging ways. So how good is your business at communicating its story? And how are you communicating your performance management story?
Today, more than ever, organizations use KPIs and dashboards to visualize what is happening— at a point in time. They don’t tell a story. A story has a storyline. Something happens in a good story. A story in interesting and captures the viewer’s attention. In business, a number or a traffic light cannot tell a story.
A good story would communicate what is happening now, what has happened in the past, why it is happening, what is being done to improve it, what should be done, who is responsible, why it is important, what is impacted by it, and so on. This involves much more than displaying data and status indicators.
What constitutes a good KPI story? To begin with, users need to understand the context. If this were a movie, this would be the background story, or the set-up, where the story is introduced to the viewer.
Necessary elements for a good KPI story
- What exactly does the KPI measure?
- Where does the data come from?
- What is the reporting period?
- What business unit is being measured?
- Who is responsible, and who are additional stakeholders?
- What are the rules that defined red, amber, green status?
- What is the purpose of the KPI?
- What domain, goal, or objective does it belong to?
Understanding the context is only the beginning. A good KPI framework should offer more than simply reporting results and statuses. It should deliver business outcomes, or impacts.
This involves a dynamic set of management processes aimed at improving performance, improving quality, using resources effectively, reducing risk, and sometimes, simply maintaining the status quo in a world of business change.

Delivering impact at the organizational level
Business impact is about going beyond the reporting of results. It is about creating a roadmap, or a storyline, for reaching targets, goals, and objectives. It requires the ability to identify what needs to be done, where, by whom, and at what cost.
To be effective, the plan for success needs to be continually re-evaluated and adjusted to ensure goals will be me. Like a good story, it will probably have its ups and downs, and maybe a few unexpected plot twists.
Telling the story to achieve business impact requires tools to support management in the following areas:
Evidence and analytics
- Analytics to identify root causes, problem areas, exceptions, outliers, and baselines
- Data visualization of performance history to analyze and identify trends
- Benchmarking to establish and create a culture of shared learning and best practices
Process support
- Tools to track improvement initiatives and activities
- Checklists to promote accountability and compliance with policies and procedures
- Evaluative commentary to narrate causes or performance issues, recommend actions, or provide additional details that go beyond the data
- Prioritization tools to optimize time and resources used to achieve goals and targets
- Forms and manual data, to fill gaps in data warehouse sources
- Approvals, alerts, and notifications, to streamline established processes
- Daily task management, to provide focus for end-users
- Access control, to ensure compliance with IT policies
Business support
- Flexible business modeling, to supply context and to organize to the performance management framework so it is understandable and easy to find
- Ability to link financial data and resources to the overall reporting system
- Ability to link other performance management models, such as risk, compliance, project management, quality improvement, employee performance, or others
- Management support, to evaluate whether resources are used effectively to drive performance
- Monthly, quarterly, and annual reports that link information from different domains
Technology enablers
Businesses have many challenges with simply reporting and visualizing KPIs. Telling the whole story introduces even more challenges to connect all the pieces. Most organizations use technology to assist them.
There are many tools available to help, and they can generally be categorized as follows: spreadsheets and dashboards, purpose-built KPI solutions, and next-generation business dashboards.
While some of these can deliver basic KPIs to the business, they often fall short of telling the whole story and delivering business impact. This article describes the fundamental problems inherent with common KPI tools, while exploring how storytelling and technology can be effectively combined to deliver business impact using business dashboards.

Spreadsheets and dashboards
Spreadsheets are an obvious starting point for tracking KPIs. They are quick and easy to set up. Dashboards follow closely behind. They are already widely used in business for data analytics. Both provide rich environments for analyzing data, and many include built-in KPI ‘objects.’
While these can be good starting points, it is often problematic to deliver KPIs using spreadsheets and dashboards. For either, KPIs typically exist only as rows in tables, or as tiles.
Neither is well-suited for providing additional business context, or for linking results to objectives, goals, teams, groups, projects, risks, or other business contexts. Neither is designed to capture elements aimed at improving performance, such as plans, initiatives, or activities, nor offer navigation.
Moreover, access control – if it exists at all, is typically at the data level, which often does not fit the needs of the business. Workflow usually is handled outside the system, if it is even supported at all. These types of tools are designed to provide insight through analytics. They are not designed to be management solutions.
Purpose-built KPI solutions
There are many types of KPI solutions on the market. These are generally web-based solutions where users can navigate through different business units, reporting periods, and KPIs organized in scorecard or dashboard pages.
Many are general solutions that meet basic needs beyond what spreadsheets or data dashboards offer, but they often lack the ability to analyze source data. This makes it difficult to understand the results. Since they lack built-in analytics, companies need to provide evidence for the results using spreadsheets or reports from other systems.
This often results an unnecessary manual effort to support what should be an automated, self-contained set of management processes. They often also lack reach into other performance management domains, such as risk or projects.
A proper KPI solution should identify performance areas that need improvement, highlight initiatives or activities intended to improve performance, and evaluate the effectiveness of these activities over time—all while managing the costs and resources as they are used. This is where business dashboards enter the picture.
Business dashboards
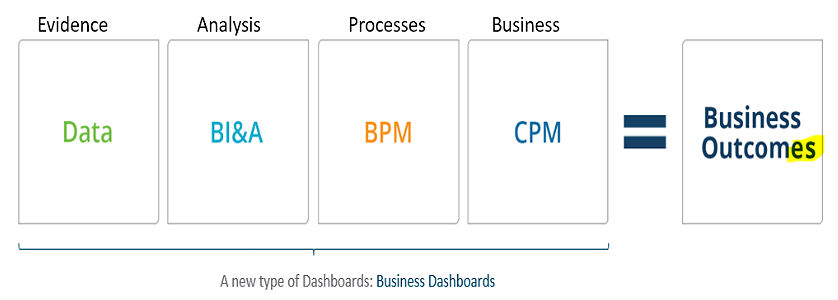
The new breed of management dashboard is called a business dashboard. These dashboards combine the general benefits of purpose-built KPI solutions with the benefits delivered by data dashboards—and they can model other performance management domains.
Furthermore, they provide the overall business context, all the key elements for story-telling, and the tools to offer detailed data analysis when needed. The key components of impact-driven business dashboards are as follows:
- Data— evidence for decision-making, both qualitative and qualitative (text and numerical)
- Business intelligence and analytics—data exploration, discovery, and visualization: to identify performance drivers
- Business processes- setting things into action, ensuring business impact, holding employees accountable: business rules, workflow, exceptions, and processes
- Corporate Performance Management— orchestration and storytelling: the purpose and framework (business model throughout the entire organization, at strategic, tactical, and operational levels)

Business dashboards are complete management solutions and offer many additional features that go beyond purpose-built KPI solutions. They can also model additional management disciplines, such as GRC (governance, risk and compliance), project portfolio management, quality improvement frameworks, enterprise risk management, employee management, and others.
Elements from these disciplines can be linked together, such as projects that improve performance, and risks that impact the projects, who is accountable, associated timelines, etc.
Summary
Do your KPIs tell a story? Or are they part of a reporting system that you use? Can your employees follow your KPI storylines, or is everything behind your KPIs an indecipherable mess? Do you have the right tools to support you in telling a good story through KPIs?
A good business dashboard solution can support you in clearly telling the entire story by offering the tools and features that business users need to deliver business impact. It can greatly reduce the time spent manually capturing the story from multiple systems and business units. Analytics and reporting tools are not enough to manage businesses.
If you have already invested in an analytics platform, a good business dashboard enables you to embed existing analytics visualizations, while providing the additional navigation, context, and process support necessary to deliver results.
About the author
Eric Peterson is the Innovation Manager at Corporater, a software company that offers its Business Management Platform to enable organizations of all types to analyze, plan, and execute to deliver business results.
As a performance management specialist, he has worked throughout the world with customers, both as a solutions specialist and as a consultant. He brings 12 years of experience in KPI and performance management best practices in a wide variety of industries, ranging from federal government agencies, oil and gas, and high-tech manufacturing.
Eric has spoken at many industry events and written numerous white papers and articles on performance management topics that combine technology with business to solve real world challenges. He can be contacted directly at [email protected].
Image sources:
Tags: Analytics, Business Strategy, Dashboard, Data analysis, Data Visualization, KPI, Organizational Performance


