Performance Management at the City of Tacoma, Washington

The City of Tacoma’s operations are constantly under track, in order to provide its residents valuable services 24-hours a day, seven days a week. The results of its performance are made available to citizens, to keep them informed about the effectiveness of the City’s programs, about the way tax revenues are being spent and about the progress toward the City’s goals.
Tacoma 24/7 is a quarterly report on 24 indicators the City monitors in 7 key service areas: Public Safety, Infrastructure, Community Services, Economic Development, Convention, Visitor & Arts, Sustainability, Open Government.
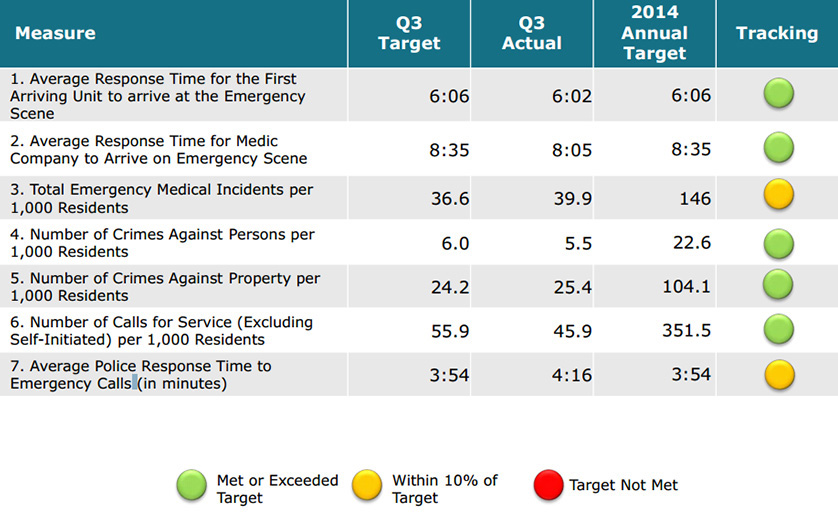
The report presents the results of the 7 indicators, monitored in the Public Safety area. Each KPI has its actual quarter result reported, along with the quarter target, as well as the yearly target, in order to track progress towards achieving the final desired result. Color codes are being used to visually spot the current performance.
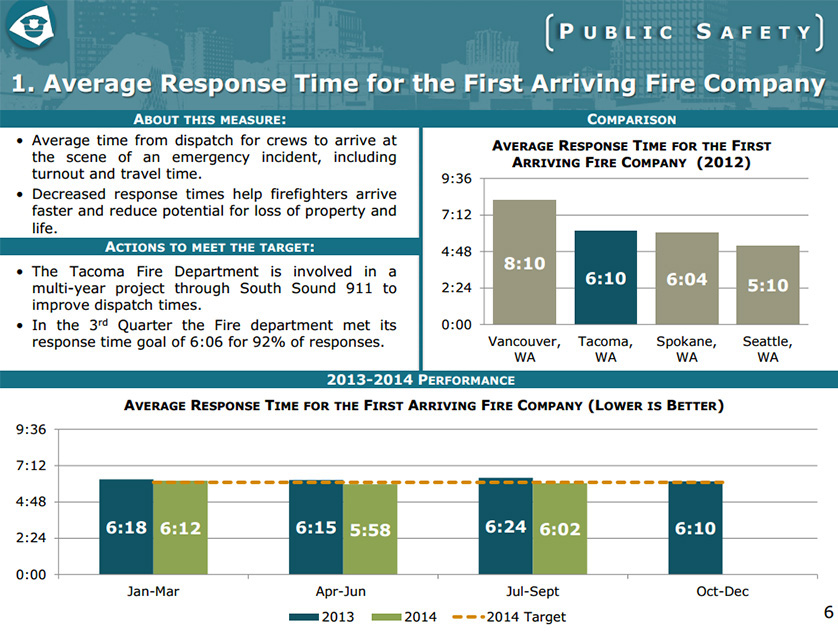
KPIs are then analyzed in further detail, in a one page report. It starts by defining the KPI and the actions taken in order to meet the established target. Then, actual results, historical data and benchmarking data is provided, in order to compare Tacoma’s results with other cities’ results. Graphs are used to enhance visualization of results.
Good practices from Tacoma’s the quarterly report:
- Report design – it is recommended that reports have both text and graphs, to allow an easier data visualization, but also to provide comments;
- Benchmarking data – to compare performance across cities;
- Quarterly and annual targets – to ensure both short and long term targets are achieved.
Recommendations:
- KPIs’ name standardization – using symbols for and easier understanding of KPIs. For example, “Average Response Time for the First Arriving Unit to arrive at the Emergency Scene” could be converted to “ # Response Time for the First Arriving Unit”;
- Performance Management architecture overview – setting one in place may prove beneficial, as it can show the connection between the tracked KPIs , the set objectives the initiatives taken to ensure objectives’ achievement. For the moment, KPIs are clustered in 7 service areas, but within each area, a set of objectives should be established;
- Graphs type – to show evolution in time, line graphs should be used, instead of bar graphs.
While the is still place for improvement, Tacoma showed that it has understood the importance of making Performance Management data available to its citizens. Residents can, at any time, access the quarterly reports and check improvement registered by the city. Also, they have an online system at hand, designed to track and solve their requests, in order to be better served.
Tacoma therefore joins the list of cities that strive for an increased performance, together with Houston, Borough of Franklin Lakes and West Sussex County. These are just some of the Governments that recently invested in better delivering their services to citizens. Their number will increase, as more and more cities try to open up and communicate more with their residents.
References:
- City of Tacoma (2014), Performance Management
- Office of Management and Budget (2014), Tacoma 24/7: Providing results on Tacoma’s core services
- City of Tacoma (2014), Online citizens reporting
Image sources:
- Freeimages
- Office of Management and Budget (2014), Tacoma 24/7: Providing results on Tacoma’s core services

Tags: Government - Local performance, Performance in USA, Performance Management


