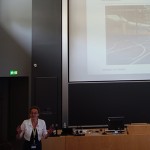
On visualization techniques with Aki Jääskeläinen and Juho-Matias Roitto at the PMA 2014 Conference
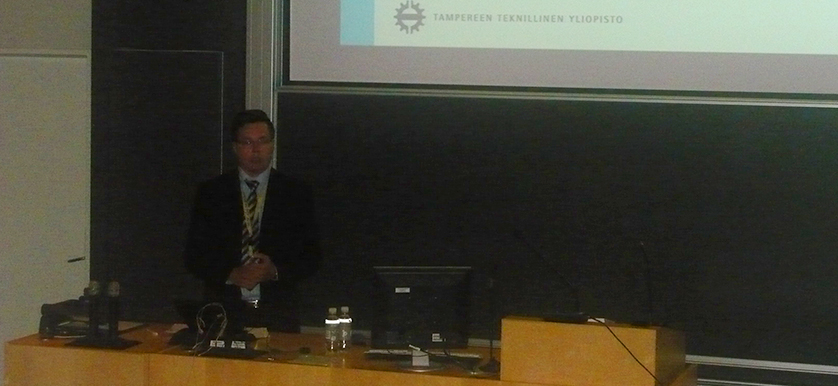
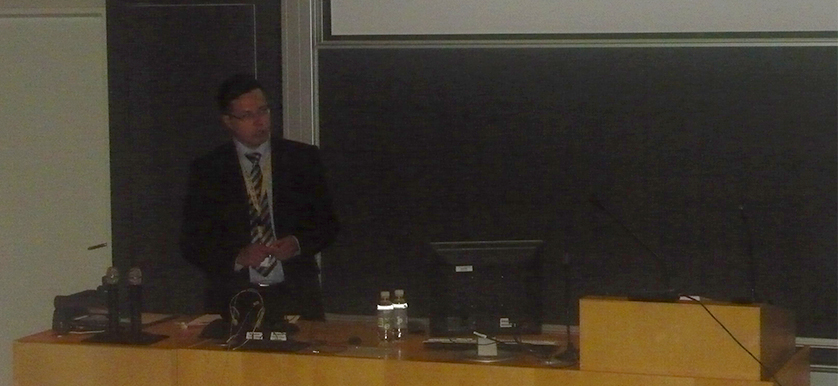
On the second day of the PMA 2014 Conference, Dr. Aki Jääskeläinen, postdoctoral researcher and M.Sc. Juho-Matias Roitto, project researcher at Tampere University of Technology, Finland delivered a presentation named “Analysis of visualization techniques supporting performance measurement process”.
The research study focused on understanding how can performance measurement be supported by visualization techniques, as well as on choosing the ones that best fit different measurement related tasks.
Aki Jääskeläinen and Juho-Matias Roitto emphasized that, despite their potential, only few visualization techniques are used in management today, which means more than using dashboards.
Through literature review, the researchers have identified different types of visualization techniques, clustered into data visualization (charts, histograms, tables etc.) and information visualization (data exploration, comparison and classification).
Jääskeläinen and Roitto presented different types of visualization instruments and techniques, along with their characteristics and utility in management, such as:
- Roadmapping
- Tree diagram of KPI
- Graphs, plots and charts
- Dashboards
- Matrix-based visualization
Another key point of their research is dividing the identified visualization techniques into the phases of a Performance Management System:
- Design: Strategy map, Tree diagram, Actor network mapping;
- Implementation: Visual metaphor;
- Use: Charts, Graphs, Traffic lights.
Descriptions are provided for each of these instruments, emphasizing their use and importance for a Performance Management System.

Tags: Data Visualization, PMA 2014 Conference
