Measuring what matters – The Boston Indicators Project
 The Boston Foundation, the City of Boston and the Metropolitan Area Planning Council are the three entities which coordinate the Boston Indicators Project, which is aimed at improving Boston’s performance as a local administration.
The indicators were selected to track the progress towards achieving established goals in 10 important areas for the city: Civic Vitality, Cultural Life and the Arts, Economy, Education, Environment, Health, Housing, Public Safety, Technology and Transportation. All these can be easily accessed by citizens on the platform dedicated to reporting the achieved performance.
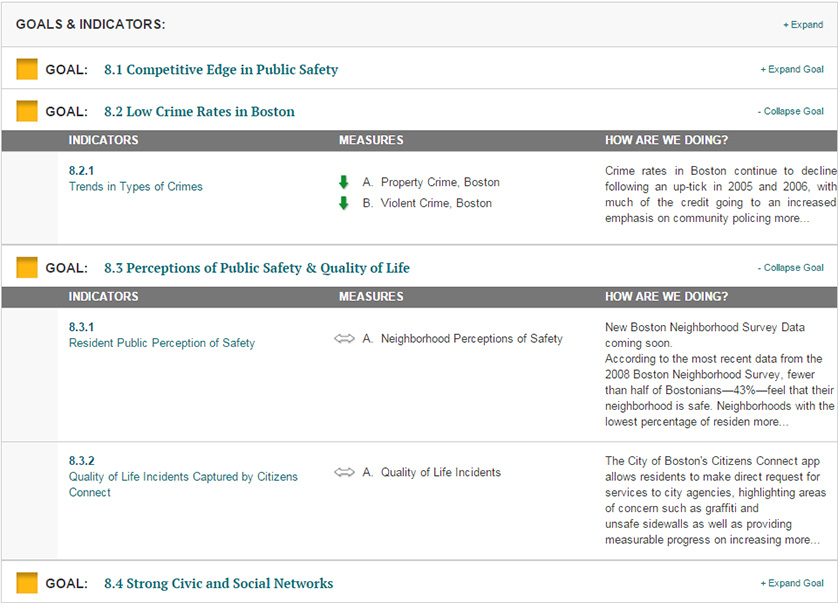
 In the table above, a part of the indicators’ framework in the Public Safety area is presented. It is structured into goals, indicators and measures. For each measure, the status towards reaching the established target is visually expressed with symbols, which provide a quick understanding of the current performance.
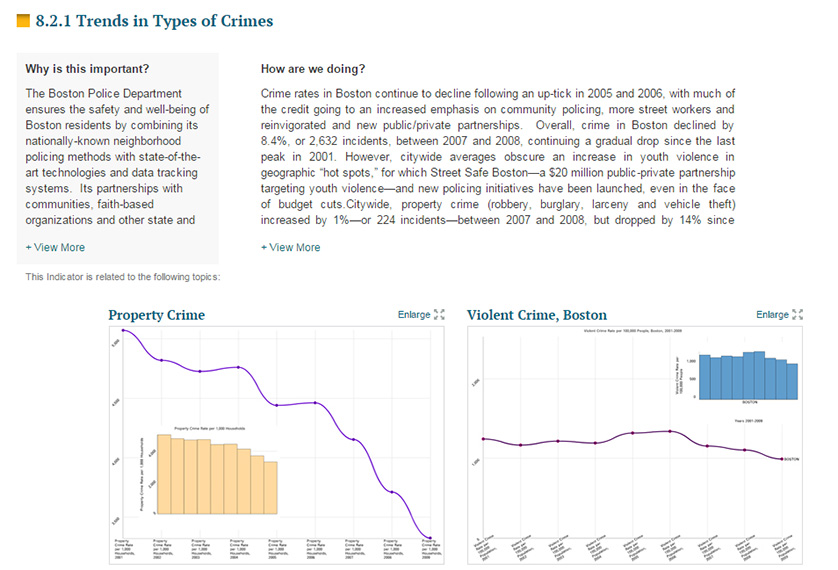
Indicators are analyzed and comments are added, in order to offer more details about the results achieved. Moreover, by clicking on each indicator, more information is available, with graphs providing trends over time, as can be seen in the caption below.
 When it comes to analyzing the framework used, indicators are understood as “positive goals for the future”, while measures are used to assess current status and trends over time. This approach, however, it is not a clear, standardized one. Usually, under each major goal, there are several objectives monitored, and Key Performance Indicators (KPIs) are used to assess performance. Going into further details, KPIs may have sub-measures, which are indicators needed in order to compute the tracked KPI.
If one would proceed to restructure the framework, described in the above, into a more rigorous one, and taking goal no 8.3 as an example: “Perception of public safety & quality of life”, the process would be the following:
- The goal would be renamed “Promote public safety and quality of life” – to give a much clear direction of what is expected to be obtained in this area;
- The goal would have attached objectives, such as: “Build a safe environment” and “Increase citizens’ quality of life” – in order to translate the goal, which is more general, into specific, actionable directions;
- Each objective would be monitored using 2 KPIs. For the first objective, possible KPIs can be “% Perception of safety and occurrence of crime”, “% Satisfied people with the way the police and local council dealt with anti-social behavior” or “# Domestic burglaries per 1,000 households”. To monitor the extent to which the local administration manages to increase its residents’ quality of life, possible KPIs can be “% Improved street and environmental cleanliness”, “% Perceptions that residents of the reference area treat one another with respect and dignity” or “# Graffiti sites cleaned”. In this way, we ensure that the established objectives are balanced, meaning that the KPIs used to monitor their progress reflect performance from various perspectives.
- In order to gather data for the KPIs presented above, sub-measures will be needed. For example, to track % Perception of safety and occurrence of crime, we first need to conduct a survey on the targeted population and to identify how many of them consider that the area where they live is a safe one. In this case, the sub-measures would be # People who perceive level of safety and occurrence of crime as being a problem in their living area and # Surveyed people from the local community.
- The Boston Foundation (2014), About the project
- The KPI Institute (2014), Public safety KPIs
- The KPI Institute (2014), Community – Quality of life KPIs
- freeimages
- The Boston Foundation (2014), Public safety: How are we doing
- The Boston Foundation (2014), Public safety: Trends in types of crimes

Tags: Government - Local performance, Performance in USA, Performance Measurement


