Measuring performance with dashboards: expectations, challenges and recommendations
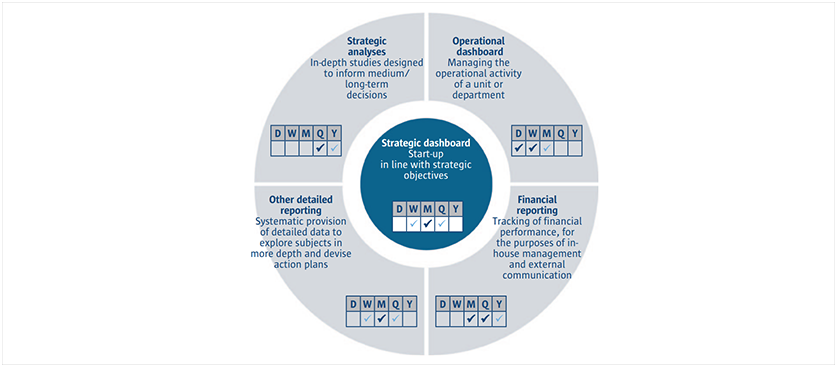
As data based decision making is at the core of better management practices today, tools such as scorecards and dashboards can assist with providing critical business data for decision making. Dashboards are operational tools used to illustrate the company’s performance in its most relevant areas. In their recent study on changing practices of financial departments and management audit in businesses (2011), Bearing Point and the Association Nationale des Directeurs Financiers et de Contrôle de Gestion (DFCG) identified several trends in using dashboards across organizations.
The study was conducted on general and finance managers who, according to the findings, expect dashboards to be a “genuine decision support tool”, helping them monitor the implementation of both strategic and operational objectives. However, 56% of general managers are dissatisfied with their current dashboards. The reasons behind their dissatisfaction include an insufficient orientation towards action and future, monitoring irrelevant indicators, insufficient commentary regarding KPIs results and lateness in availability.
On the other hand, only 34% of finance managers are dissatisfied with the dashboards they use. The results of the study show that the level of satisfaction towards using dashboards depends on the expectations people have from using such a tool. Therefore, it is important to understand how to properly configure a dashboard and avoid common mistakes in using them. Some recommendations include:
- Using an adequate number of KPIs – a maximum of 15 is recommended;
- Aligning KPIs across the organization – implement KPIs at organizational level and cascade them to departmental and individual level;
- Ensuring accountability – each KPI should have a KPI owner and a data custodian;
- Including past results and benchmarking data – useful for identifying trends.
The study also concluded that the leading dashboard tool is Microsoft Excel, because it is a flexible, easy to use solution, yet complex enough to display the required information. However, implementing more interactive dashboards adds value to the business, making data available much more easily and rapidly.
The challenge lays in changing the focus from Business Intelligence systems used mainly for measurement and reporting, to those that also support analysis, prediction, forecasting and optimization. Other emerging practices revealed by the study include:
- Monitoring performance using variance analysis – it is the key to identifying the factors behind each result and try to address the cause instead of the effect;
- Combining risk analysis with performance management – Key Risk Indicators (KRIs) provide an early signal regarding an increased risk exposure in a certain area of operations, thus the ability to anticipate future drops in performance;
- Properly allocating resources – KPIs are needed to reflect the value added by the human capital, as well as the progress towards achieving more with less both in terms of financial, time and natural resources.
References:
- Bearing Point and DFCG (2011), Dashboards: expectations, practices and results
- The KPI Institute (2014), The 2014 trends in software solutions. Magic Quadrant for Business Intelligence and Analytics Platforms
- The KPI Institute (2013), 5 common mistakes in dashboard design
- The KPI Institute (2013), The importance of tracking performance in a dashboard
Image source:

Tags: Business Intelligence, Dashboard, KPI, Performance Management


