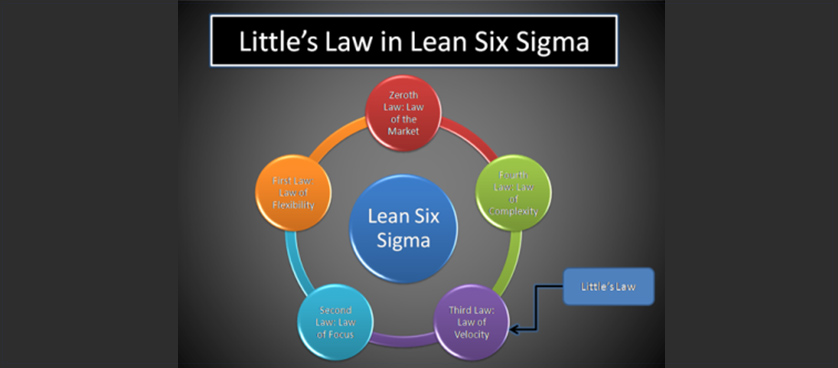
Little’s Law: a fundamental principle used in performance measurement and Lean Six Sigma
Developed in 1961 by a former Massachusetts Institute of Technology (MIT) professor, John D. C. Little, the law that carries his name (Little’s Law) has emerged from being a queue theory at its origins to being applied currently in a variety of other aspects of every-day life, such as: Project Management, Manufacturing, Supply Chain etc.
Originally, Little’s Law was explained in the queuing theory as shown above (McDonough, 2009):
L = λ x W
Where:
L = # Long-term customers in the system
λ = # Long-term average arrival rate
W = # Long-term average time a customer spends in the system
Nowadays, the principle has become one of the fundamentals of Lean Six Sigma, a method that aims at increasing overall business performance (increased speed and reduced waste) and customer satisfaction.
Lean Six Sigma is based on five fundamental laws (Aveta Solutions, 2009), one of them being the Law of Velocity that relies on the equation embedded in Little’s Law:
# Work in process = # Throughput x # Average flow timeThis can be applied in performance measurement in practically any kind of industry. Several examples could be the following:
In airlines, you know that you have an average queue size of 20 passengers and a throughput of 300 passengers embarking per hour, meaning 5 passengers per minute. To calculate the average time a passenger waits in the checkpoint queue, you will have to divide the work in process or the average inventory (of 20 passengers) to the throughput (5 passengers/minute) and you obtain an average wait time of 4 minutes.
In a restaurant, you serve an average of 50 customers per day (considering you are open for 10 hours from 12.00 to 22.00, that would mean a throughput of 5 customers/hour). At any time, there is an average of 10 customers, meaning an average inventory, inside the restaurant. If you wish to know the time a customer spends on average inside the restaurant, you divide the average inventory (of 10 customers) to the throughput (of 5 customers/hour) and obtain a 2 hours average flow time.
This has several implications for managers in their performance measurement and management initiatives, the most important being that, for a given throughput, the only way to reduce flow time is to reduce the inventory or the work in process.
Further reading:- Business knowledge source (2010), Six sigma laws – the law of velocity
- Business Knowledge Center (2010), Process analysis
- Aveta Solutions LLC (2009), „The Five Laws of Lean Six Sigma”
- McDonough, M. (2009), „Little’s Law and Six Sigma”
- McDonough, 2009

Tags: Lean Six Sigma, Little's Law, Massachusetts Institute of Technology, Performance Management, Performance Measurement


