Improving performance in the City of Seattle

Making data available to citizens is no news for the Governments which aim at improving their current level of performance. The City of Seattle has understood that a transparent approach to conducted activities and obtained results is the leading path towards both a better relationship with the citizens, and a roadmap to performance.
On its official website dedicated to performance, The City of Seattle presented results in 6 areas: Public Safety, Transportation, Community and economic development, Utilities and environment, Housing, Human services and education, Operations and innovation. The future directions aim at having all these departments monitored.
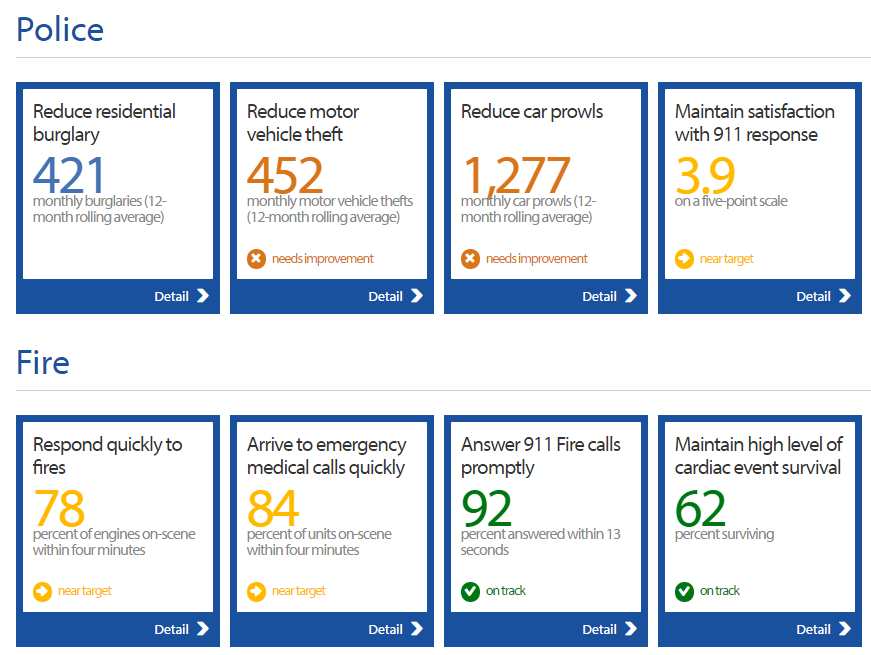
Each of the 6 departments mentioned above is further split into more detailed areas. For example, under public safety, there are 3 services monitored: police, fire and emergency management and preparedness.
For each service, clear objectives are set, together with specific KPIs and targets to be achieved. To monitor the performance obtained in the police service, 4 objectives had been established:
- Reduce residential burglary;
- Reduce motor vehicle theft;
- Reduce car prowls;
- Maintain satisfaction with 911 response.
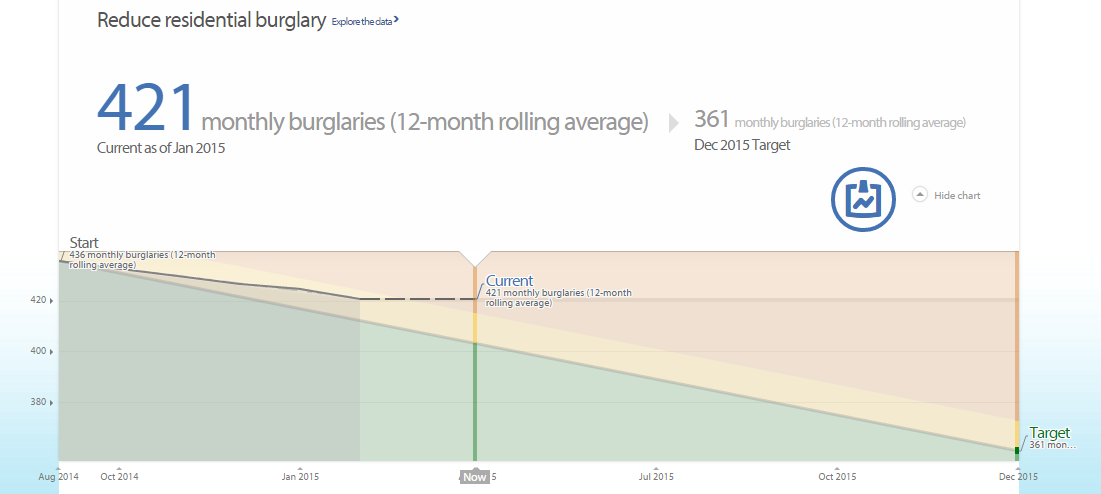
Further details can be explored in order to report progress towards achieving the target set for each objective. In the graph below, the results of the monthly burglaries can be spotted:
At the beginning of the reporting period (August 2014), there were 436 burglaries per month. The current result (January 2015) is at 421, which means that only a 3.5% reduction has been registered in 5 months. The target to be achieved (December 2015) is 361, which, as the graph reveals, is not likely to be achieved.
The target line represents the necessary progress needed to attain the target. The current result is above this line and, if the historical trend (3.5% reduction every 5 months) is maintained, the target will be missed. To prevent this from happening, actions need to be taken.
Thus, the Seattle Police Department has developed the SeaStat crime reduction program, aimed at addressing crime related challenges. The department meets twice a week to review reports of incidents, and come up with solutions to reduce crime.
On the other hand, # Citizens satisfaction with 911 responses is nearly reaching the target. The KPI is monitored through regular telephone surveys, satisfaction being measured on a scale from 1 to 5, where 5 stands for “Extremely satisfied”. The current result (December 2014) is 3.94, which is close to the target of 4. However, the historical data does not show a solid increase of this KPI, because, as of July 2006, the result was 3.95, and it underwent multiple fluctuations (from 3.80 to 4.5).
Excluding the graph, other details are available for each KPI, such as: the importance of the goal, means of measuring the goal, progress achieved so far, and other information. In this manner, the reasons behind monitoring those specific KPIs and not others, are made even clearer.
The City of Seattle Dashboard is very similar to the one used by the West Sussex County, United Kingdom, which monitors performance across 3 areas: children, elders and economy. Using similar software to report performance and, additionally, using the same set of KPIs, helps citizens better understand how their city is performing, as compared to others.
References:
- The City of Seattle (2015), SeaStat
- The City of Seattle (2015), Welcome to Performance Seattle
- The KPI Institute (2014), Making performance data available to citizens – West Sussex County
Image sources:

Tags: Government - Local performance, Government performance, Performance in USA


