Financial Performance Benchmarking within the Electricity Utilities

In 2017, The KPI Institute, through its Center for Performance Benchmarking and Utilities Performance Labs, launched an extensive secondary benchmarking initiative which consists of 6 individual reports; 2 reports for each of the 3 utilities sectors – water, gas and electricity. The sixth and final report of the Utilities Performance Benchmarking Report Series 2017, “Financial Key Performance Indicators for Electricity Utilities” ends the series and provides a detailed analysis of the financial indicators monitored by electricity providers. This report includes data from 59 electricity utilities located in 30 countries situated on 5 continents.
The companies were chosen in order to showcase the level of financial performance from different world regions as geographical matters can influence to a certain extend the operations and the geographical coverage of utilities companies. Moreover, in order to enable comparison for a wide range of companies, the report includes companies with different structures in terms of size, number of employees or departments.
Financial gains surely are on top of priorities for all for-profit companies, independent of the sector they activate in. While for the non-financial indicators companies have more flexibility in regards to what they measure, in terms of financial KPIs, the performance management framework in place is more stable, hence most companies measure more or less the same KPIs, facilitating comparison among companies through a benchmarking initiative.
The aim of the Utilities Performance Benchmarking Report Series 2017 is to enable professionals to activate new KPIs within their utilities organizations based on their usefulness for other companies from the sector, to help them set targets for the newly activated KPIs or to facilitate the comparison of the results for organizations that already measure those indicators.
The 20 key performance indicators included in the report were structured into a comprehensive framework consisting of 5 clusters further divided in sub-clusters if the case. The KPIs contained by the report were selected by the specialists from The KPI Institute based on their experience and based on an initial market analysis.
A) The first cluster, Assets and Liabilities is divided in two main sub-cluster: Assets, showcasing expected financial benefits within one year, and Liabilities, reflecting on the expected debt within one year.
Out of the nine indicators included in this cluster, we found $ Intangible assets and $ Non-current liabilities as some of the most representative for electricity utilities, given the high number of companies from the industry reporting them.
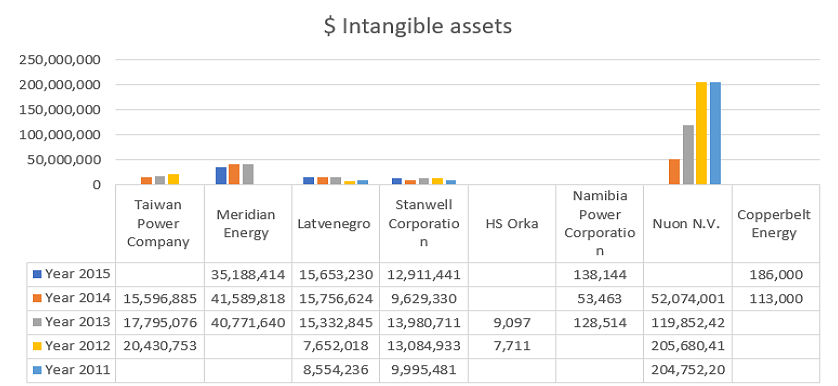
- $ Intangible assets measures the value of fixed assets that are not physical by nature (cannot be seen, touched or physically measured). One way an organization might gain intangible assets is through the sale or purchase of business units.
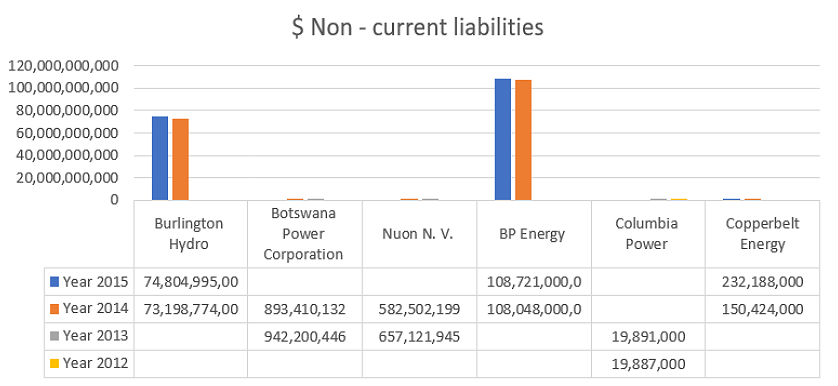
- $ Non-current liabilities measures the amount of debt for terms longer than one year. Non-current liabilities may be composed oflong-term borrowing, bonds payable and long-term lease.
B) The Revenues and Costs cluster includes 3 KPIs, which reflect on the cash flow of electricity utilities organization. For example, we have noticed that $ Revenue is, from obvious reasons, the KPI used more frequently for measuring the revenues of electricity company.
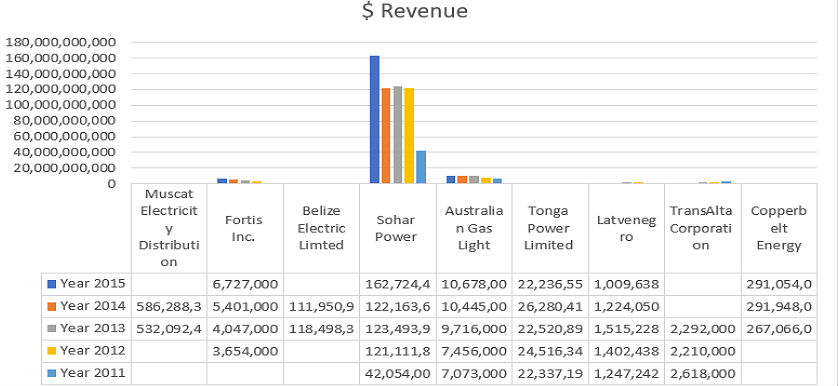
- $ Revenue measures the total income earned within the reporting period. When measuring $ Revenue, organizations include the discounts or deductions, as it is calculated by simply multiplying the selling price by the number of units.
C) The third cluster, Profitability, pinpoints, through 4 main KPIs, on the financial performance and earnings of electricity utilities. One of the most representative example of KPI in practice seems to be $ EBITDA, given the large number of organizations measuring it.
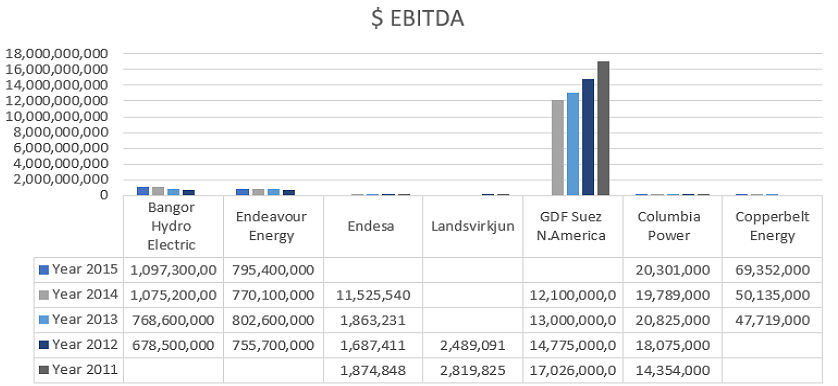
- $ EBITDA measures a company’s financial performance before considering interest expense on debt, tax expenses, depreciation and amortization charges, in order to showcase the company’s operating profitability.
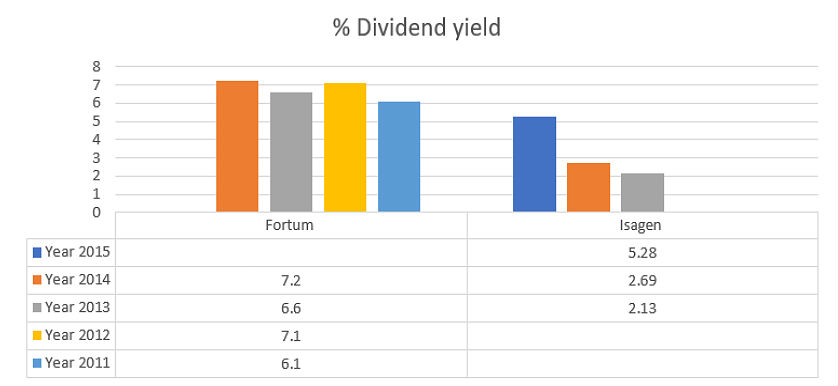
D) The Shareholders’ Profitability cluster contains 3 metrics related to the gains of the organization’s shareholders. A good example noticed in practice is % Dividend yield, which measures the proportion of annual dividends paid for each share, relative to the market share price. It does not include any capital gains.
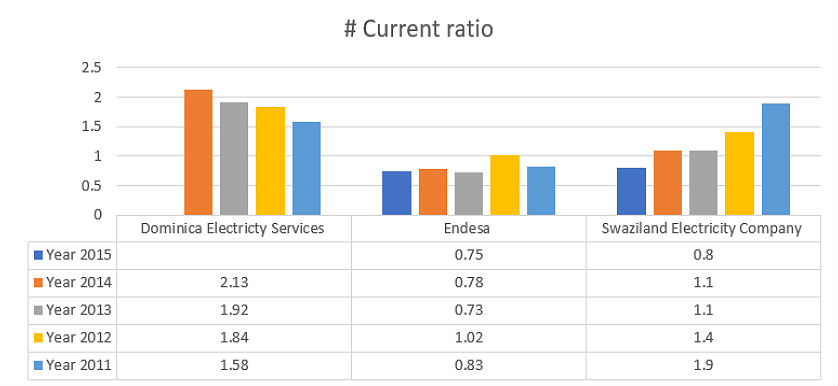
E) The Financial Stability contains one KPI that reflects on the organization’s ability to pay its short and long-term obligations. # Current ratio is most frequently used in practice in order to showcase the financial stability of an organization as it measures the relationship between short-term obligations (debt and payable) and short-term assets (cash, inventory, receivables), giving an indication of liquidity, or the company’s ability to pay its short-term obligations.
In order to generate added value from a benchmarking initiative, organizations have to choose correctly their benchmarking partners. For the utilities industry, appropriate benchmarking partners should:
- have almost the same number of employees;
- have a close number of customers or connections;
- have a similar geographical coverage;
- have similar external conditions.
Image source:

Tags: Electricity performance, Key Performance Indicators, KPI, Report Analysis

