Chart of the Week: Greenhouse Gas Emissions in China and India

Welcome to the first chart from The Uncharted: Chart of the Week!
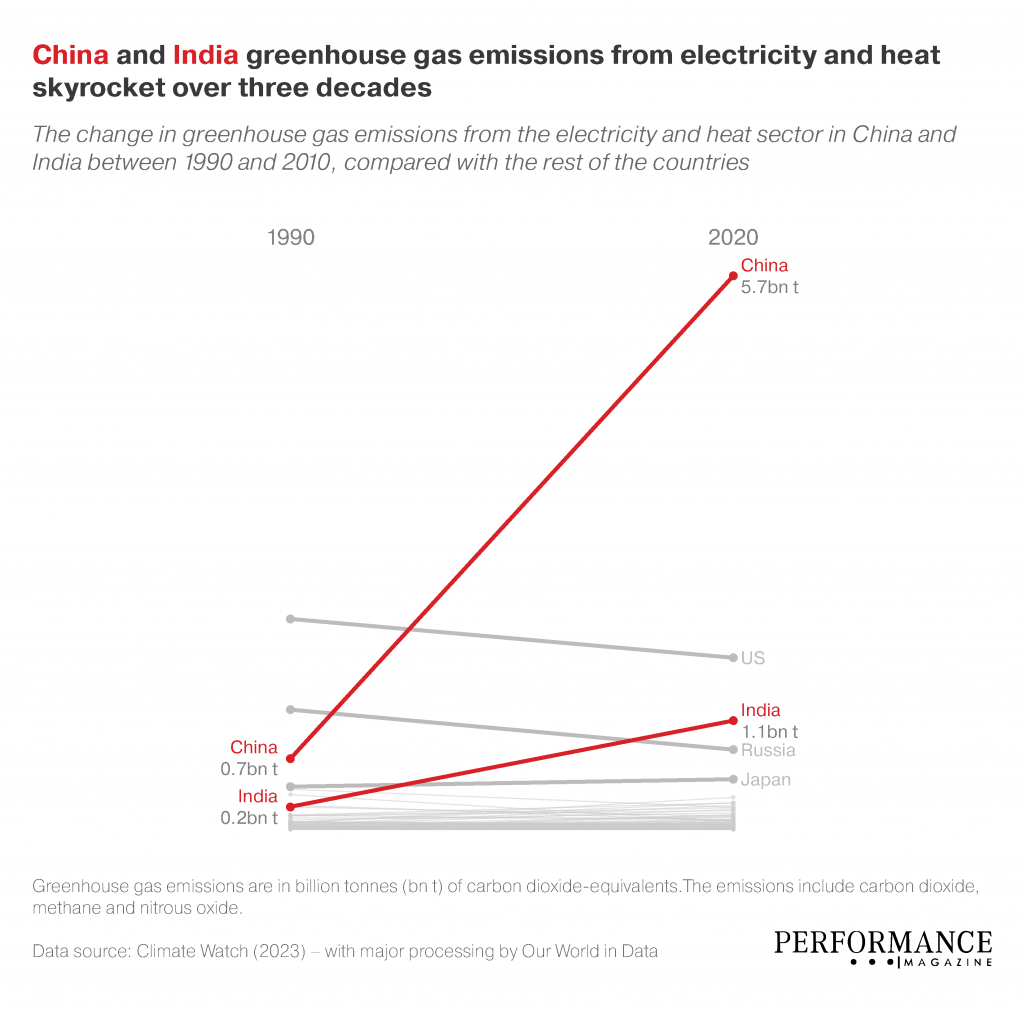
This week, we look at how greenhouse gas (GHG) emissions from the heat and electricity sector—more than any other industry—are skyrocketing in China and India.
The electricity and heat sector, which consists of electricity plants and energy generators that use fossil fuels, is the main source of GHG emissions compared to other sectors, recording 15.2 billion tonnes of carbon dioxide-equivalents in 2020, up from just 8.7 billion tonnes in 1990.
By transitioning to renewable energy and improving energy production and consumption efficiency, 51 out of the examined 169 countries have managed to curb their GHG emissions over the past three decades, including the United States(US), Russia and the United Kingdom (UK).
However, the exact opposite happened in China and India. While China was the third most intensive emitter of GHG in 1990 with 0.7 billion tonnes, the emissions escalated to a staggering 5.7 billion tonnes—an almost seven-fold increase.
In India, the electricity and heat sector was the top eighth in GHG emissions in the world in 1990, with 0.2 billion tonnes. Emissions increased by almost four times as much in 2020 with 1.1 billion tonnes.
In both countries, the surge of GHG emissions is attributed to major economic developments, rapid industrialization, and substantial population growth, in addition to their dependency on coal and fossil fuels, despite their efforts to diversify their energy mix.
The figures show how maintaining ambitious economic development while curbing emissions for lasting sustainability can still practically be an unsolved challenge, even for some major developed countries.
Fortunately, curbing GHG emissions is possible, and it starts with your business by monitoring and managing its emissions using the relevant KPI. That is why The KPI Institute published a full documentation for the # Greenhouse gas emissions KPI, available for free here.

Tags: charts, Data Visualization, gas emissions, Oil and Gas performance, The Uncharted


