Experts define high-performance culture as a set of shared beliefs and values set up by leaders. These shared beliefs and values are then embedded and communicated through different strategies that eventually form employee perceptions, behaviors, and understanding.
All companies want their employees to arrive each day motivated, prepared, and energetic to do what it takes to make the work done. However, it’s more of an idealism than a reality. A State of the Global Workplace report from Gallup shows that only 15 percent of employees are engaged at work. Meanwhile, new research from Zenefits revealed that 63.3% of companies consider employee retention more challenging than hiring.
The Pillars of a High-Performance Culture
Several reports and case studies emphasize the impact of motivation on employee performance. While there are means to address waning motivation, a “well-performing” company isn’t good enough. With the capacity to trade globally, and markets immersed with companies scrambling for market share, it is more critical than ever to have a distinctive, high-performance culture.
There are many frameworks to analyze high-performance culture in an organization. One example of a well-developed and data-driven framework for assessing a high-performance culture can be seen in the Organizational Health Index.
Developed by McKinsey in 2017, the Organizational Health Index (OHI) survey measures 37 individual management practices and nine outcomes against a global database of more than 1.5 million individual responses.
The Role of OKRs in Building a High-Performance Culture
Objectives and key results (OKR) is a goal-setting tool used for measuring organizational/departmental/individual objectives through challenging and ambitious key results. Extracted from the organization’s visions and missions and aligned with the department’s goals, OKR involves activities such as planning, activating, managing, and adjusting.
With OKRs, teams can cascade and align goals to the different levels of an organization, defining outcome-based key results that help verify the success of the objective. OKRs act as a guide for daily work and connect all employees to a larger purpose, which is what the organization intends to achieve.
If OKRs are perceived as more than just a goal-setting tool and instead as a communication one, it shows why the OKRs are brilliant at building a high-performance culture. The effort of achieving daily goals at the individual and team levels eventually leads to the achievement of the overall objectives at the organization level in the long run.
As a result, when implemented correctly, OKRs can help a company enable a high-performance culture and achieve far more than their team thought possible. OKRs help the organization adopts performance culture in the following ways:
OKRs provide organizations with a clear direction, coordination, control, and orientation. Direction, coordination, control, and external collaboration play a vital role in helping organizations jump from their current state to the state they want to achieve. To guide the organization in achieving what they desire, it’s important that the organization ensures that its vision and strategic clarity are understood by the stakeholders in every layer, and while doing so, the organization must also facilitate the involvement of its employees.
OKR helps organizations align priorities and make sure everyone at every level in the organization moves towards the same goals. Employees must be given the opportunity to provide their insights when the organization decides in the next 12 months. It is recommended to start with an OKR workshop where all key stakeholders responsible for company strategy ask for and gather input from employees on what they think the top priorities should be.
Those inputs can then be aligned with the existing company strategy and broken down into three to five OKRs. The process can be done using collaborative notes and documents or even a whiteboard to ensure that collaboration and ideas are well-captured. The goal of the process is to reach an agreement on what priorities should be achieved in the following year.
The process is then followed by aligning the company OKRs with team and individual OKRs. OKRs provide teams and individuals with a clear set of directions and achievements. OKRs are also a reason to remove things that are unrelated to the scope of the objective they wanted to achieve, keeping their focus and avoiding unnecessary activities or resources.
If every team gets the opportunity to create their own OKRs that they will be working on in a particular quarter, for example, it can assure a successful OKR program while helping the organization realize its strategy and maintain its focus.
OKRs increase employees’ motivation, innovation, capabilities, and accountability. OKRs can be used to develop a set of productive behaviors that establish an essential motivating culture. Through the process of building OKRs, employees set the outcomes they’ll achieve. These outcomes are in line with the organization’s setup that supports autonomy and motivation.
In addition, OKRs focus on outcomes over outputs. It is a way to resolve organizational problems and gives employees the flexibility to experiment, innovate, and think outside the box. It also allows a humanistic approach, rather than a systemic approach. OKRs promote positive behavior by providing continuous reflection and iteration about the organization’s goals, sharing progress updates, and keeping goals collaborative, all while observing freedom and trust.
OKRs are more than just a goal-setting framework. They enable stronger and healthier relationships within companies and support powerful dynamics in an organization that will significantly increase performance levels.
To start doing the OKRs right, companies can hire an OKR expert to start partnering with their organization or provide their managers with training. The KPI Institute’s Certified OKR Program can equip them with the right tools, knowledge, and guidance in deploying OKRs in their organizations.
Click here for more articles on OKRs and organizational performance.
********
Editor’s Note: This article has been updated as of September 17, 2024.
The case below explores the implementation of a standardized Operational Deployment System (ODS) at Corewell Health West, a healthcare system in West Michigan. The goal of the system was to align operational processes and improve efficiency across physician and non-physician stakeholders. By implementing ODS, the organization aimed to enhance quality, increase patient satisfaction, optimize operational efficiency, and reduce costs while ensuring staff and physician satisfaction.
Background
Corewell Health West is a complex large healthcare system in West Michigan with 31,000 employees (4600 providers). Due to its large footprint in West Michigan, it aims for transformation to improve quality, increase patient satisfaction, deliver operational efficiency, and reduce costs. Foundational to all this work is staff and physician satisfaction. There was a need for shared language to communicate critical goals in a way that allowed us to be efficient while creating a standard approach to work. To move such a large team in one coordinated direction, Corewell Health needed to engage in focused efforts in a way that was respectful to its teams and leaders.
The ODS was designed to help leaders clarify what is most important and align the right resources to meet the goals set. This system, composed of best practices from individual project management and process improvement methodologies, was implemented to provide clarity, cascade goals appropriately, and help prevent employee burnout by creating a system of intentional alignment.
ODS Implementation Process
Implementing the Operational Deployment System begins with an annual goal-setting process led by the executive team and subject matter experts in the areas of cost, quality, people, and value. There is then a multi-week process of cascading these goals from the executive team through various levels of physician and operational leadership to front-line staff. Subsequent conversations called “catch-ball” follow in which each level of leadership discusses and eventually finalizes goals in each of the four categories. This process culminates with executive sign-off, confirming the roll-up of goals at each level to ultimately achieve the system goals. These goals are captured in a document called an Operational A3 (see sample). Each level of leadership, starting at the director level, has an OA3 that outlines the annual goal in each category and provides space for monthly data updates and explanations.
The manager level of leadership does not have an OA3 but instead utilizes a reporting tool called a gate chart (see sample). Each goal has a separate gate chart featuring a leading metric (the metric that aligns with the director OA3), a lagging metric, and specific tactics and timelines for impacting performance.
Following this goal-setting process and after populating the OA3 and gate charts, weekly report-outs begin each week focused on one of the four priority areas. Report-outs take place in a virtual meeting with managers reviewing the gate chart performance with front-line staff. This is followed by managers reporting their gate chart update to directors, who then provide a similar report to Physician and Operations Vice Presidents (VPs), and so on. Each of these report-outs follows the TAPE methodology, which stands for Target (what was the goal), Actual (what is the actual performance metric), and Please Explain (what were the actions or factors that contributed to that month’s performance).
Change Management
The ODS process inherently supports change management surrounding efforts to meet annual goals by engaging the front-line staff and every level of physician and operational leadership in goal setting, action plan development, and performance tracking. A key component of successful implementation is training leaders and teams in the ODS process. Training sessions for all levels of leaders included a review of the principles of ODS, the OA3 and gate chart templates, and the TAPE reporting format, and included time for discussion and questions. Implementing operational goals, management for daily improvement and cascade reporting, and communication were key areas of discussion during these training sessions.
Stakeholder Experience
To gauge the stakeholder experience, VPs and Director-level physician and operational leaders were surveyed about their experience with ODS. Among the 54 respondents, 61% agreed or strongly agreed that ODS has allowed them and their upline to focus on key areas for operational success. Moreover, 69% agreed or strongly agreed that ODS effectively aligns operational tactics with system strategy.
Lessons Learned and Next Steps
The ODS at Corewell Health initially faced challenges as leaders at all levels adjusted to this new form of tracking and presenting metrics. As the process matured, these perceived notions morphed into support, engagement, and eagerness to introduce new ideas.
Survey results indicate that the leaders perceive improved focus in key operational areas due to ODS. The system has been adopted outside of service lines as well. Hospital medical staff leadership embraces value in aligned goals and now reports on the executive dashboard. Independent physicians are looking at ways to use ODS to improve their private practice structure and function.
Implementing an Operational Deployment System at Corewell Health has been thought-provoking, enlightening, and rewarding. Previously top-down leadership in this space has moved to shared decision-making. As ODS progresses through year three, physician and operations leaders will build on lessons learned and broaden skills to make ODS an even richer process and a model for other organizations to follow.
********
Editor’s Note: The authors are Aiesha Ahmed MD, MBA (VP, Population Health, and Chief of Neuroscience); Rashelle Ludolph (Operations Director, Medical Specialty Services); Cheryl Wolfe MD, MBA (VP, Chief of Women’s Health), and Sonja Beute (Director of Strategic & Operational Deployment).
This article has been updated as of September 17, 2024.
“What constitutes a good KPI example?”, “How should KPIs be measured?”, “Which KPI is suitable for our organization?”, and “How well will employees understand and participate in tracking these KPIs?” These questions often loom large for companies seeking to select the right KPIs to accurately measure their performance and progress toward strategic objectives.
According to The KPI Institute’s (TKI) State of Strategy Management Practice Global Report – 2023, choosing the right KPIs ranks as the second most significant obstacle in strategy planning.
The report further reveals a concerning trend regarding the challenges associated with working with KPIs. Results indicate a surge in the hurdles associated with KPI selection compared to the previous year.
Several factors contribute to the challenging nature of KPI selection, including the need to align with strategic objectives; the common practice of defining initiatives before KPIs rather than defining KPIs and targets first and then developing initiatives to reach them; clearly differentiating between strategic and operational KPIs at the departmental level; and focusing too much on task-related KPIs rather than impact KPIs at the employee level.
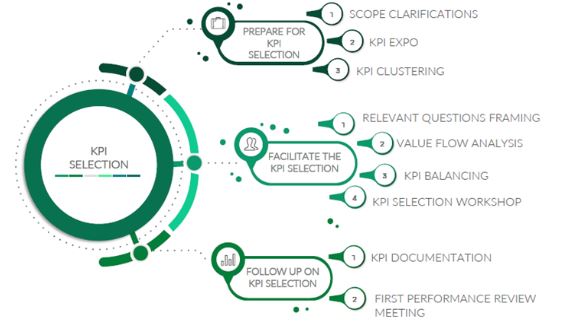
3 stages of KPI selection
Selecting the right KPIs requires careful planning, analysis, and collaboration across various organizational areas. A rigorous KPI selection process typically involves three major stages (see Figure 1).
Your initial step in the process is to set a clear direction for KPI selection by recognizing the business objectives and goals that must be attained. This is essential to ensure that all personnel are working towards the same objectives and that progress can be efficiently monitored. This stage clarifies the necessity and application of measurement while precisely defining the intended purpose of the KPIs.
Next, conduct thorough research to gather a range of KPI examples. This serves a dual purpose: educating your internal stakeholders and fostering meaningful discussions about KPIs. This process, labelled as the KPI expo, entails compiling a comprehensive list of KPIs that will later be filtered based on a set of criteria.
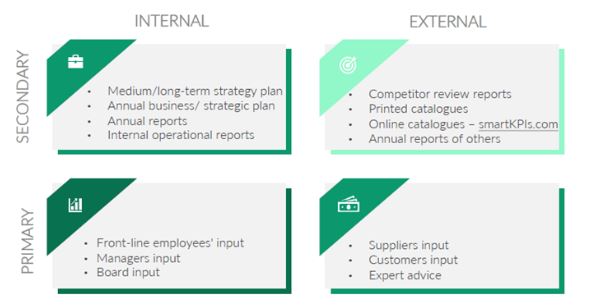
You should review both internal and external data sources (see Figure 2) to leverage existing practices while also gaining insights into industry best practices. The KPI expo can include existing KPI lists from various organizational levels, which may already be in use or have been tested within your organization.
In the next stage, use intelligence gathering and conduct workshops to identify suitable KPIs. You can obtain insights from a diverse range of stakeholders, including clients, suppliers, employees, and management. This approach will foster broader buy-in and support.
TKI recommends the following selection methods to ensure the identification of relevant KPIs:
Question framing: Guide discussions toward relevant contexts and gather participant perspectives. Questions might include, “How many KPIs should we select?” or “What is the procedure for validating the selected KPIs?”
Value flow analysis: Examine the flow of value within business processes—from inputs to outcomes—to understand how objectives can be measured from different perspectives.
KPI balancing: Avoid narrow perspectives by selecting at least two complementary KPIs per objective, ensuring the measurement of both quantity and quality, subjectivity and objectivity, and efficiency and effectiveness.
Additionally, among the existing criteria in practice, TKI suggests using these five to ensure KPI relevancy:
Measurable: Can the KPI result be quantified?
Accessible: Can your organization feasibly gather the necessary data?
Specific: Does the KPI address a specific issue you have?
Actionable: Does it provide information for decision-making?
Balanced: Does it reflect various facets of performance?
The final stage in the KPI selection process involves monitoring the selected KPIs for necessary recalibrations. This can be achieved through two key activities: KPIs documentation and the performance review meeting.
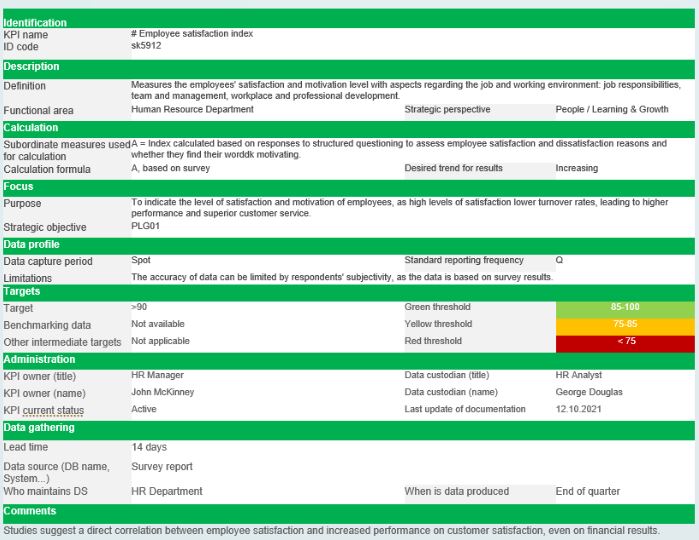
KPI documentation can reveal limitations associated with data collection or reporting and gaps in the cost-benefit analysis of the KPI’s usage. Develop a comprehensive set of information for each selected KPI to facilitate data collection, reporting, and analysis.
Use a standard template, known as a KPI documentation form (see Figure 3), capturing each KPI’s details, definition, calculation formula, target, data source, reporting frequency, KPI owner, and data custodian. For more examples, you can explore TKI’s comprehensive repository of KPIs at smartKPIs.com.
The first reporting and performance review meeting for the new KPIs will reveal their utility for decision-making. It provides managers with an overview of how the KPIs cover all aspects of the business and helps identify necessary adjustments to the corporate scorecard, ensuring that the most relevant data is available for decision-making. Facilitate this first meeting through your strategy office.
After this final stage, your KPIs can be maintained as initially selected, recalibrated and updated, or even phased out of use based on their effectiveness and relevance to your organizational goals.
By following these stages, you can select and implement KPIs that accurately measure performance and support strategic objectives, ultimately driving your business success and growth.
Ready to take your KPI selection to the next level? Head over to the KPI section on our website for more in-depth articles and expert advice.
To be competitive in today’s fast-changing business environment, companies must continually increase efficiency. Reengineering workflows and business processes may help accomplish this. Business process reengineering is a company management technique that analyzes and redesigns workflows and processes. It completely restructures company operations to increase quality and improve costs, service, and speed. In the early 1990s, BPR was introduced to identify, evaluate, and restructure an organization’s essential business processes to eliminate redundancies, reduce mistakes, and boost efficiency. It rigorously analyzes, rethinks, and redesigns mission-delivery processes. Business process improvement (BPI) differs from BPR. The latter rejects rules and revamps processes from a high-level viewpoint, unlike BPI, which only makes incremental adjustments.
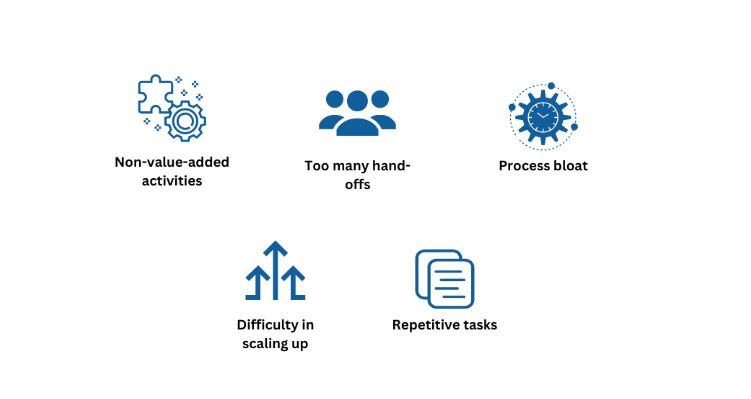
Identifying the Triggers for BPR
Figure 1. BPR Triggers | Source: Adapted from LinkedIn
Businesses may realize the need for BPR when they observe certain signs that indicate inefficiencies or bottlenecks in their current processes. Here are some key indicators that suggest a business might benefit from BPR:
Non-value-added activities: These are tasks or processes that do not add value to the business or its customers.
Too many hand-offs: Processes involving too many hand-offs or transfers between different departments or individuals can lead to delays and miscommunication.
Process bloat: Overly complex or bloated processes can slow down operations and reduce efficiency.
Difficulty in scaling up: This occurs when a business struggles to scale its operations due to inefficient or poorly integrated systems.
Repetitive tasks: These are characterized by employees finding themselves doing the same thing repeatedly, especially tasks that could be automated.
Process mapping: This involves defining the scope, purpose, and goal of the project, and then mapping out the sequence of tasks or steps that are performed to achieve a certain goal or outcome. This can help identify gaps, redundancies, bottlenecks, delays, errors, and rework in the workflow.
Analyzing current processes: This involves reviewing the current workflows and processes to identify inefficiencies and areas for improvement. This includes looking for common inefficiencies such as overproduction, waiting, transportation, overprocessing, and motion.
Identifying redundancies: Redundancies are any processes, procedures, roles, reports, meetings, or other business activities that are duplicative, outdated, or otherwise unnecessary. Once these are identified, they can subsequently be eliminated.
Using workflow analysis tools: Workflow analysis tools can help visualize, analyze, and improve business processes. These tools can identify inefficiencies, streamline operations, and automate manual tasks.
Implementing automation: Workflow automation tools can help streamline routine business processes for optimal efficiency. These tools can reduce busy work and optimize processes, allowing employees to focus on more important tasks.
Benefits of BPR
Improved collaboration: Optimized processes, particularly those that are automated, provide a centralized system for tracking tasks and sharing data. This shared access to information can improve collaboration among departments, reducing the risk of miscommunication and errors.
Enhanced productivity: Process optimization can lead to significant increases in operational efficiency. By streamlining processes and automating routine tasks, employees can work more effectively and deliver quality work in a timely manner.
Empowerment: Reengineered processes often involve redistributing power and authority among functions and levels, empowering individuals to think, interact, use judgment, and make decisions. This fosters innovation and creativity among employees, leading to better solutions to problems and faster problem-solving times.
In 2008, Domino’s stock price hit an all-time low, rendering it nearly bankrupt. The transformation began with a complete overhaul of its ingredients, recipes, and menu, but the real game-changer was its focus on digital transformation.
Domino’s focused on three key areas for its digital transformation: customer experience, data analytics, and technology infrastructure. The company implemented a unified digital platform that integrated online ordering, customer feedback, and delivery tracking.
One of the most significant steps in this transformation was the introduction of the “Pizza Tracker” technology in 2008, which kept customers updated on the progress of their orders. This innovation, along with others, changed the brand perception of Domino’s from a pizza delivery company to a technology-driven company.
By 2018, Domino’s overtook Pizza Hut as the largest pizza delivery company globally, with a market share of 18.6%. The company’s revenue grew from $1.4 billion to $3.5 billion, and its net income increased significantly. The company’s stock price also saw a dramatic increase, from around $3.00 a share in 2008 to $211 in 2018-2019.
In Conclusion
BPR is a critical component of any organization’s quest for maximum efficiency. By identifying and eliminating inefficiencies, streamlining processes, and fostering a culture of continuous improvement, organizations can successfully reengineer workflows, enabling them to stay competitive in today’s rapidly changing business landscape.
For more insightful articles on organizational performance and other similar concepts, click here.
In an era when environmental concerns are at the forefront of global discussions, businesses are being called upon to integrate sustainability into their operations. Developed as an extension of the traditional Balanced Scorecard (BSC), the Sustainability Balanced Scorecard (SBSC) aims to provide businesses with a tool to align their environmental, social, and economic objectives, driving positive impact while ensuring long-term success.
The Genesis of the SBSC
The concept of the BSC was first introduced by Robert Kaplan and David Norton in the early 1990s as a framework to measure business performance beyond financial metrics. The BSC aimed to provide a more holistic view of an organization’s health by incorporating four hierarchical perspectives: Financial, Customer, Internal Processes, and Learning & Growth.
A decade later, as sustainability became a critical global concern, scholars started looking into the possibility of integrating sustainability considerations into the BSC. They agreed on the potential of extending the focus of the well-established BSC to include measuring business performance through the lens of environmental stewardship, social responsibility, and ethics. Thus, the concept of the SBSC began to crystallize.
When it comes to the best architecture for the SBSC, there have been conflicting discussions ever since the concept was introduced. Two major approaches took prominence: one is to add a fifth perspective to the traditional BSC that was dedicated to sustainability; the other is to integrate sustainability objectives and KPIs into the already existing perspectives.
A 2009 study showed that in the fifth perspective approach, sustainability KPIs tend to be overlooked by management in organizations with no established sustainability culture. That is why the four-perspective approach can be a safer choice, especially for organizations that are only starting to integrate sustainability in their measures.
In a 2021 article, Kaplan supported the four-perspective approach, introducing a suggested restructuring of three out of the four perspectives to make them more relevant to environmental, social, and governance (ESG) elements:
From “Financial” to “Outcomes” to include environmental and societal objectives besides the financial aspect
From “Customer” to “Stakeholder” to reflect the value of different members of the whole ecosystem
From “Learning & Growth” to “Enablers” to encompass the various capabilities across all stakeholders in the ecosystem
Reaping these sustainability integration benefits can be a bit of a long shot, and further studies are needed to prove such benefits even exist. However, the only way to reap said benefits is to plant the seeds of sustainability integration. To help accomplish this, the SBSC can be a potent tool that allows organizations to measure, manage, and optimize their sustainability performance. As global challenges such as climate change, resource depletion, and social inequality loom larger, businesses must go beyond profits and consider their broader impact. The SBSC empowers organizations to embrace sustainability as a strategic imperative, paving the way for a more responsible, resilient, and prosperous future.
For more on utilizing the Balanced Scorecard, The KPI Institute has developed the Certified Balanced Scorecard Management System Professional to help organizations maximize the tools’ potential. And if you are interested in expanding your toolkit further, consider subscribing to smartkpis.com and gain access to the world’s largest database of documented KPIs, which includes a thorough collection of sustainability metrics.