The balanced scorecard (BSC) is a widely used performance measurement framework for strategic planning. It is so popular, in fact, that The KPI Institute’s latest State of Strategy Management Practice report found that 40% of respondents from Middle Eastern companies were using it. Why is that the case? It’s likely in the name—the BSC offers a balanced perspective of a company’s performance, focusing not just on financial gains but the various aspects of value creation as well. This enables companies who use it to establish sustainable business practices that can meet long-term goals without sacrificing short-term improvements.
What Is the BSC?
In 1992, Robert Kaplan and David Norton dreamed of a better way. Aware of the limitations of traditional practices that focused solely on financial indicators such as return on investment (ROI) to measure a company’s performance, the two designed a tool that incorporated non-financial variables to paint a more holistic, comprehensive picture. Thus, the balanced scorecard was born.
The BSC was further refined by connecting performance metrics directly to strategy, which marked a formal link between strategic goals and performance measurement. In 1996, it became a performance management system (PMS) that effectively integrated the various crucial aspects of an organization—i.e. strategic processes, resource allocation, budgeting and planning, goal setting, and employee learning.
By 2001, the BSC had outgrown its original form, no longer seen as a mere management tool but instead as an all-encompassing strategic management and control system. The BSC has continued to evolve alongside the ever-changing priorities of the business world. In 2021, many companies began integrating environmental and social dimensions into their BSCs to reflect their triple bottom line strategies.
The BSC gives managers a view of the business from four crucial perspectives. Each perspective deals with an integral aspect of the organization and answers a specific question:
Customer Perspective: How Do Customers See Us?
Companies typically have a mission statement that encapsulates how they interact with customers. For example, e-commerce platform Etsy’s mission statement is “Keep Commerce Human.” This sentiment informs the way the company does business, which places importance on leaving a positive economic, social, and ecological impact.
The BSC holds companies accountable to their mission statements by translating them into specific measures that must be followed. For Etsy, one aspect to consider would be the diversity of its workforce, which falls under social impact. To address this, the company has taken measures such as increasing the presence of underrepresented communities in its seller community by interviewing candidates from those backgrounds. This has enabled the company to stay true to its mission and show customers that it walks the talk.
Internal Perspective: What Must We Excel At?
Balance is the primary focus of the BSC—it’s in the name, after all. Thus, the framework doesn’t only take into account the way customers perceive the company, but it also considers what the latter does to shape this perception. This is composed of the various operational and organizational processes that drive the company.
By giving managers an internal perspective, they can identify, track, and measure the processes that yield the most benefits and close the gaps on the ones that fall short.
Learning and Growth Perspective: Can We Continue to Improve and Create Value?
The business landscape is constantly shifting, and in order to keep pace with its changes, businesses must consistently learn and innovate. That is the importance of this perspective, which states that a company’s value hinges on its ability to improve. In any industry, competition can be fierce, which means companies must always find new ways to stand out.
Financial Perspective: How Do We Look to Shareholders?
Among the four perspectives, this is perhaps the most straightforward. Put simply, it indicates if a company is profitable. Although financial performance is no longer the end-all, be-all measure of a company’s success, it still plays a crucial role in determining whether a company is simply surviving or thriving. Shareholders understandably value profitability, and they won’t keep investing in a company that doesn’t produce ROI.
The BSC is by nature a holistic framework, meaning each part is interconnected to the others. This is why it’s important to take a balanced (pun intended) approach when considering the four perspectives. If one side is prioritized over the others, it could lead to the formation or widening of inefficiency gaps that impede business growth and success.
As previously mentioned, the BSC is quite popular. This is due to the myriad of benefits that it brings to organizations that use it wisely. The most obvious benefits of the BSC are twofold. First, it consolidates the seemingly disparate aspects of a business in a single report, leading to increased efficiency in performance reporting and measurement as well as faster decision-making. Second, the BSC helps mitigate suboptimization by making managers consider the entirety of the company’s operational measures, demonstrating whether one objective was achieved at the cost of another.
A more concrete example of the BSC benefiting companies can be seen in how Apple uses the framework. By shifting its focus from innovating its products to also paying mind to customer satisfaction by establishing it as one of the company’s core tenets, the tech giant was able to improve its already stellar reputation by catering to its customers’ desires. Apple also values core competencies, employee commitment and alignment, market share, and shareholder value. Together, these indicators make up the metrics of their BSC.
World-renowned electronic company Philips is also known for its use of the BSC, using a bespoke version of the framework to fit its organizational needs. The company’s focus is on its employees, and it uses the BSC to ensure that each member of its workforce has a clear understanding of the company’s strategic policies and long-term vision.
What Does the Future Hold?
There must be a stronger emphasis on customization as companies realize that there is no such thing as a one-size-fits-all approach to performance management. This aligns with the proliferation of new advancements in artificial intelligence (AI) and machine learning (ML), technologies that must be integrated into the BSC lest the framework fall behind the ever-shifting realities of the business world. Regardless of the future, the BSC appears poised to remain a vital tool for companies of all sizes and in all industries.
Interested in learning more about the BSC? Browse our articles here.
What truly drives organizational success is not just a brilliant strategy or a cutting-edge technology. It also lies in the collective talent and potential of employees. To optimize organizational performance, organizations can develop and enhance human capital through capacity building. The University of California, Davis defines capacity building as “the process by which people and organizations obtain, improve and retain the skills, knowledge, tools, equipment and other resources needed to do their jobs successfully.”
Today, one concrete sign of the growing recognition for nurturing human capital is the increased attention to wellness programs. A powerful connection exists between capacity building, employee well-being, and organizational performance, fueled by both theoretical frameworks and empirical evidence. Two main theories provide a foundation for understanding this relationship:
Human Capital Theory: This theory posits that employees are a treasure trove of skills and knowledge, waiting to be unleashed and nurtured to increase organizational productivity and success. By investing in capacity-building, organizations enhance their human capital, leading to improved performance.
Organizational Support Theory: This theory proposes that when employees perceive their organization as supportive, their commitment to their jobs increases, their performance improves, and their stress and strain are reduced.
From the empirical perspective, a robust body of research supports the link between capacity building and organizational performance. One study demonstrated strong evidence that implementing capacity-building programs positively impacts talent development, employee resilience, and career development, leading to improvement in overall organizational performance. Further reinforcing this connection, another study examined the responses of 710 manufacturing small and midsize enterprise (SME) owners and found that organizational learning is crucial for both performance and success.
Extending this research to a specific context, in the United Arab Emirates (UAE), a study revealed that investing in employee training is crucial for sustainable success. However, talent attraction and retention alone do not significantly impact organizational performance. This connection underscores that while having skilled employees is important, the true driver of long-term success lies in the continuous development of those employees through effective training programs rather than merely focusing on hiring and keeping talent.
Finally, a case study of Metropolitan International University revealed that capacity-building programs have significant positive links with critical performance outcomes such as innovation, customer satisfaction, productivity, and retention.
The positive correlation between capacity-building initiatives and organizational performance is supported by compelling data.
Training programs play a crucial role in enhancing workplace dynamics, significantly impacting productivity, job satisfaction, and employee retention. Research from eLearning provider TalentLMS indicates that 80% of employees believe training directly boosts their productivity, while 75% find it beneficial for their engagement and overall job satisfaction. Furthermore, the retention power of training is evident, as 76% of employees are more likely to remain with a company that prioritizes continuous training. This sentiment is echoed by 86% of HR managers, who recognize training as a vital factor in fostering employee retention. Collectively, these insights underscore the importance of investing in training initiatives to cultivate a motivated and committed workforce.
In addition, training fosters performance enhancement among employees. Fifty-one percent believe it increases their confidence and 41% assert that it improves their time management skills. Beyond individual performance, training also strengthens employees’ connection to their organization and reinforces their sense of purpose. Notably, LinkedIn’s Workplace Learning Report 2024 shows that 80% of employees find learning experiences fulfilling and meaningful in their roles, while 70% feel a deeper connection to their company through the availability of training opportunities.
Implementing Effective Capacity-Building Programs
Effective capacity-building programs demand thorough planning and execution. This is exemplified by the U.S. Centers for Disease Control and Prevention (CDC). Their implementation shows that before initiating capacity-building efforts, it is essential to assess existing skills, structures, and resources to ensure a solid foundation for development. Once this assessment is complete, connecting relevant partners with expertise in the program can help identify capacity gaps, informing future development and potential partnerships. Building qualities such as trust, mutual respect, and commitment among all members of the organization is crucial for fostering a collaborative environment.
CDC’s roadmap for state program planning also shows that implementing a variety of engaging multimodal learning programs—including lectures, discussions, simulations, and case studies—can cater to diverse learning styles. Additionally, integrating technology through online learning platforms and interactive simulations can facilitate more dynamic engagement. Finally, it is important to monitor the impact of these training initiatives on specific goals, using key performance indicators (KPIs) such as productivity, quality, and employee engagement to evaluate effectiveness and drive continuous improvement.
Indeed, capacity building is essential for organizations to thrive in today’s global market. By investing in it, companies can enhance performance, achieve goals, and gain a competitive edge. Research consistently demonstrates a strong correlation between capacity building and organizational success, as evidenced by improved employee engagement, productivity, and overall performance.
Impact investors aim to achieve measurable financial returns while maintaining positive social and environmental impacts. Recent empirical research has shown that value investors consider Environmental, Social, and Governance (ESG) practices in their investment decision-making processes, although the emphasis on these indicators varies across industries.
However, impact investing is not a new concept. In fact, it could be traced back to 1928 when the first screened investment fund was established in the United States. As environmental awareness grew, the concept of responsible investing gained more traction within the investment community. This trend continued to evolve until the rise of Stakeholder Capitalism Theory in the 1950s and 1960s, which advocated maximizing value for all stakeholders, including customers, employees, suppliers, and local communities.
During the ’60s and ’70s, socially conscious investors began avoiding funds with investments in industries like tobacco or weapons. Presently, many companies are embracing balanced performance goals known as the Triple Bottom Line (TBL). Some investors are even willing to pay a premium for companies demonstrating positive ESG impacts, indicating a growing preference for environmentally and socially responsible investments.
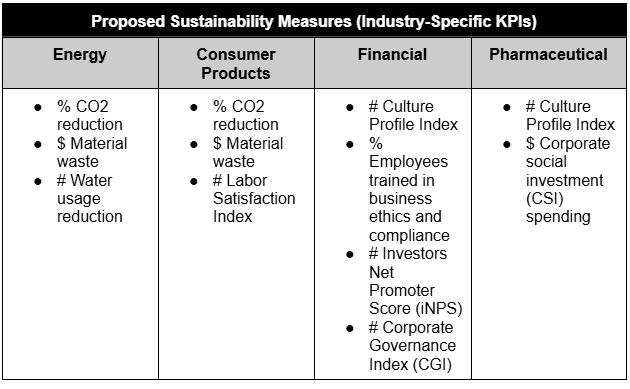
Given the varying ESG priorities across sectors, there is no one-size-fits-all strategy or performance measures to be adopted by companies that want to attract and retain value investors and their equity capital. To illustrate this, former Forbes staff writer Kathryn Dill said, “Certain indicators are prioritized over others across industries. For example, safety rankings are not particularly important to banks, as the financial sector work doesn’t pose physical danger. But safety performance is an important measure of sustainability in the transportation industry, where physical well-being can be at stake”. Henceforth, strategists and performance management professionals may need to emphasize specific aspects of ESG based on their investors’ preferences, as shown in the figure below:
Energy Sector: Due to the energy industry’s inherently high carbonated emissions and the amount of waste generated and water used, strategists within this sector should focus on initiatives related to lowering CO2 Emissions, material use, waste production, and water usage. To measure this, they may use KPIs such as % CO2 reduction, $ Material waste, and # Water usage reduction, respectively. In this regard, the environmental aspect of ESG takes precedence.
Consumer Sector: Similar to the energy sector, there is an emphasis in the consumer sector related to reducing emissions, material use, and waste production as part of the environmental dimension of ESG. However, this is in addition to the need for further focus on decent labor practices—falling under in the social dimension of space of their ESG strategy—which could be measured using the # Labor Satisfaction Index.
Financial and Insurance Sectors: In these sectors, organizational culture, diversity, and inclusion matter with regards to the environmental dimension. Meanwhile, governance structures, advocacies, and business ethics matter in the governance dimension. The potential KPIs used in these industries may include: # Culture Profile Index, % Employees trained in business ethics and compliance, # iNPS, and # CGI.
Pharmaceutical and Medical Sectors: Strategists in these sectors need to worry about community impact and labor practices, which fall under the social dimension. They must also focus on business ethics in the governance dimension. Candidate KPIs here may include # Culture Profile Index and $ CSI spending.
All the strategic themes and underlying indicators proposed above should only be considered guides at best. A better approach is for companies to communicate with their communities and involve stakeholders in their policies, decisions, and operations to cultivate a fully supportive investment strategy implementation system.
In conclusion, performance management professionals should collaborate closely with strategists to align sustainability objectives and KPIs with strategic initiatives through cascading and appropriate KPIselection techniques, regular measurement frameworks such as the strategic scorecard, and implementation of performance improvement best practices such as regular performance review meetings which are all crucial to ensure that the company remains on track with its sustainability goals relevant to today’s investment community.
**********
About the Author
Tarig Malik is a seasoned Strategy and Performance Management Professional with extensive expertise in enhancing strategic, operational, and individual performance. Holding multiple certifications (SPP, C-BSC, C-OKR, C-KPI), Tarig leverages a strong academic foundation and practical experience to drive continuous improvement and foster a performance-oriented culture across various organizations.
Assessing core competencies should be a top priority for all organizations that want to distinguish themselves from the competition and seek to gain competitive advantage. The concept of core competencies gained traction in the ‘90s, when academicians C.K. Prahalad and Gary Hamel emphasized its importance in an article titled The Core Competence of Corporation, linking its utility to the organization’s evaluation of strengths and weaknesses.
In the article, Prahalad and Hamel assert that managers should consider identifying and evaluating the company’s unique skill sets and the technologies that distinguish them from their competitors to improve resource allocation, leverage current strengths, and select opportunities based on their alignment with those strengths. Thus, the conceptualization of core competencies has led to a rethinking of the concept of corporation, shifting the focus from restructuring and decluttering to identifying, cultivating, and exploiting competencies.Recognizing and leveraging these competencies can be the key to gaining a sustainable competitive advantage, yet this begs the question: how do we evaluate and identify core competencies?
Depending on the industry and organization, core competencies can vary among: buying power, company culture, customer service, partnerships, adaptability to product design, low product prices, or niche specializations. However, there are three criteria that Prahalad and Hamel consider of greatest importance when assessing core competencies: rare, challenging to imitate, and beneficial to customers. Those criteria represent the starting point for developing a competency framework.
For example, The University of Newcastle, Australia has developed a competencies framework to map individual competencies for professional staff, with the main competencies evaluated being: communication & engagement; organisational [sic] planning & project management; professional & technical expertise; business understanding & business intelligence; and creative & strategic thinking. Although the same principle applies when assessing competencies at the organizational level, the context is different because the focus shifts from the staff to the organization as a whole, covering processes, activities, technology, products, partnerships, culture, synergies, etc. Building a competency framework can be done in various ways as long as it respects the three criteria mentioned earlier.
Establishing a Core Competency Framework
Start by reviewing the organization’s foundation, like the mission and value statements. Afterward, identify competencies embedded into the foundation, create competency levels, and interview or survey internal staff and major clients. Last but not least, use valuable, rare, imitable, and organization (VRIO) analysis to measure competencies on a scale and determine which of them meet all the criteria to be considered core competencies. The final step should be to validate your core competency framework with both internal and external stakeholders, i.e. top management, managers, supervisors, employees, and partners.
Leveraging Core Competencies
Below are some examples of core competencies identified among globally recognized brands that shaped and consolidated their market position, helping them build an undeniable reputation. McDonald’s managed to stand out and achieve supremacy in the fast-food industry due to positive brand awareness and portfolio of trademarks, Netflix excels in innovation, brand equity, and product mix, while Starbucks’ core competencies include high-quality products, aesthetically appealing locations, and strong market position.
Here’s the bottom line: knowing where you stand out as an organization can impact the entire business, outlining areas of improvement, contributing to better resource allocation and driving innovation.
Click here for more articles that discuss corporate performance.
Productivity is a measure of the efficiency of production, expressed as the ratio of output to inputs used. Performance is defined as the accomplishment of a given task measured against preset standards of achievement, such as accuracy, completeness, cost and speed.
In the wider context of performance management, productivity is measured against productivity KPIs. In their simplest form, productivity KPIs, such as # Units per man-hour, stand at the basis of both modern and older performance evaluation systems. However, it is only but natural that we ask ourselves the following question: How much productivity is there left to both measure and reflect on performance?
In her book, The Measurement Nightmare: How the Theory of Constraints Can Resolve Conflicting Strategies, Policies, and Measures (1999), Debra Smith talks to her readers about a real-life situation, based on one of the most common productivity KPIs in use: # Units per man-hour. And it all starts with defining the KPI. According to her, # Units per man-hour is a “summary of standard costing’s use of standard labor hours and standard labor rates, resulting in labor variance analysis and decisions designed to improve.”
“There is not one productivity indicator that does not reflect on performance. And there is not one neglected faction of performance that does not impact productivity in one way or the other.”
From here on, Debra Smith describes this particular situation in which, on an intuitive basis, some executive manager from a manufacturing company decides to increase # Units per man-hour by cutting labor costs with highly automated machines. So, instead of six loom operators, four were assigned to tend to one loom per shift.
And the effect was as expected…at first. # Units per man-hour had increased at the loom. However, because of the downtime of the looms which now increased, the total output of the looms had decreased.
Due to a lack of attending operators, the downtime of the machines escalated up to a point where it impaired all subsequent processes. When that happened, all downstream processes began to suffer from starvation. % On-time delivery of products declined, $ Labor costs went up due to # Overtime and, instead of going up, $ Net profit went down.
Debra Smith’s account of the negative side effects one productivity measure can propagate, when taken out of the context of performance, stand to show that there is more to productivity in performance than counting outputs per unit of input. And this is more visible when dealing with the most popular dimension, which is labor productivity.
In the context of performance management, labor productivity can be translated through individual KPIs. When dealing with employee performance, individual productivity KPIs become part of a more complex performance evaluation system. The overall individual performance index simulates an average between the score of the individual performance scorecard, the individual competencies score, and the employee behaviors score.
Where do KPIs fit into this equation? Productivity KPIs are mindfully incorporated into the individual performance scorecard, to best reflect the quantitative aspects of employee performance. And this is where everything gets tricky and we start asking ourselves: How much of one employee’s performance should be measured in terms of quantity?
Image Source: Freepik
Let’s take, for example, the automotive industry. With automotive manufacturing, productivity is a key performance indicator that measures the total production volume of the actual manpower, while taking into consideration the effective days officially scheduled for each automobile.
The core performance indicator of the automotive industry is # Hours per unit or # HPU, and it reveals the number of hours required to build a car. However, at its basis, this # HPU cannot be measured outside # Available manpower, # Effective working time, and # Individual production volume. Let’s add % Absenteeism rate to this reasoning.
When dealing with target production volumes it is important that the plant works at its full throttle to achieve those targets. Given this requirement, % Absenteeism rates should not be overlooked, as they have a major impact on the # Effective working time, which here on, impacts the # Production volume, and, ultimately, the # HPU.
However quantifiable, % Absenteeism rates also reflect on less quantifiable variables. This further takes us to the issue of % Employee engagement: a roughly quantifiable, uncontrollable driver of not only productivity but of performance as well.
So, how much productivity is there left, to both measure and reflect on performance? A great deal. And maybe the best way to look at it is by envisioning this revolving cartwheel…this continuous circle, which turns productivity into performance and vice versa.
All things considered, there is not one productivity indicator that does not reflect on performance. And there is not one neglected faction of performance that does not impact the former in one way or the other.
For more articles on productivity improvement, click here.
**********
Editor’s Note: This article has been updated as of September 18, 2024.