In this free webinar from The KPI Institute, our General Manager for EMEA, Adrian Brudan, explains the importance of key performance indicator (KPI) documentation. Discover how documenting KPIs enables organizations to establish effective KPI governance, accountability, and stakeholder buy-in.
Implementing a Key Performance Indicator (KPI) System is a vital step in strengthening an organization’s performance management and strategic alignment. However, to ensure the KPI system brings meaningful value rather than becoming a bureaucratic burden, it must be introduced with care.
Two of the most critical factors in this process are the speed of implementation and the timing of deployment.
The speed of implementation is a delicate balance between urgency and patience. While it may be tempting to fast-track the process to show quick wins or satisfy leadership expectations, introducing a KPI system too quickly can backfire. People are naturally resistant to change, especially when it brings new procedures or measurements into their daily routines. If the implementation is rushed, employees may view the KPI system as an imposed burden rather than a valuable tool. This resistance can erode trust, reduce participation, and ultimately lead to the failure of the performance management system (PMS).
Instead, leaders should consider a phased and inclusive approach. Gradually introducing the system allows time for employees to understand its purpose, see the connection to their work, and feel part of the process. This builds a sense of ownership and alignment with organizational goals. A KPI system should foster focus and clarity—not just create more forms and dashboards. Without this human connection, it risks becoming a layer of paperwork that adds complexity without driving results.
Equally important is the timing of deployment. Organizations operate in cycles, and there are always periods of high intensity—year-end closings, peak sales seasons, or major product launches. During these high-stress periods, teams are focused on immediate deliverables and managing volumes, not learning new processes or reflecting on long-term measures. Introducing a KPI system during these busy times can overwhelm staff and lead to poor adoption.
To maximize impact, the implementation should be scheduled during a quieter period when people have the bandwidth to engage with the system thoughtfully. This allows better participation in workshops, training, and feedback sessions. It also ensures the system is not seen as an added stressor, but as a support structure that enhances performance and decision-making.
Ultimately, a KPI system must be more than a technical exercise. It requires cultural adoption, leadership commitment, and careful planning. The right speed ensures people can adapt and connect with the system, while the right timing ensures they have the energy and attention to engage meaningfully.
In conclusion, the implementation of a KPI system should not be rushed or poorly timed. Success lies in managing change with empathy and strategic foresight. By respecting the pace of human adaptation and the rhythms of the business, organizations can build a KPI system that is not only effective but also embraced by those it is meant to empower.
In recent years, the global labor market has faced a challenging mix of health crises, economic turbulence, and geopolitical uncertainties, with vulnerable populations most severely affected. In response, companies are taking on greater roles in supporting vulnerable groups while championing diversity, equity, and inclusion (DEI). The surge in companies adopting DEI programs underscores the growing recognition of DEI as a strategic imperative and a driver for improving work performance.
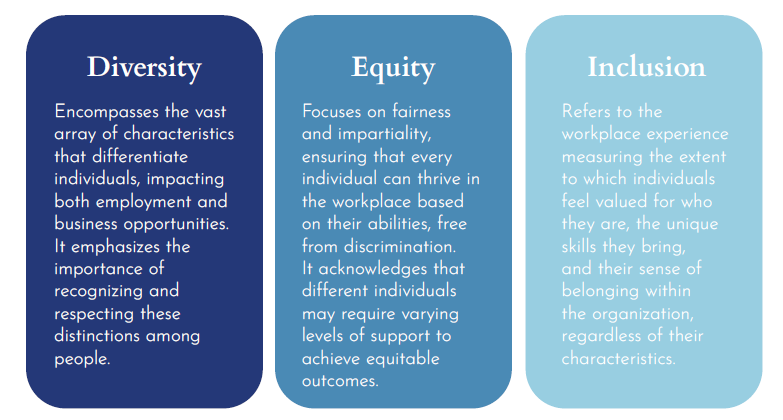
DEI is a framework that promotes fair treatment and equal opportunities for all employees across a spectrum of protected characteristics, including age, race, religion, gender, and more. The three components of DEI are deeply intertwined (see Figure 1). Each plays a role in establishing workplaces where all employees can thrive. They cannot be addressed as stand-alone criteria, requiring a collective approach to create a truly inclusive and equitable workplace.
The significant value and impact of DEI in various aspects of work make it a moral imperative and an essential strategic requirement that businesses must not underestimate or overlook.
For instance, the “2022 Global Inclusion and Diversity Transparency Report” by intelligent power management company Eaton emphasized the success of its Stretch Assignment Marketplace (SAM), where diverse teams of employees handled 86 business challenges across multiple areas. Employees can select projects that interest them, with up to six people per team allowed six months to finish each challenge. Notably, the company saw an 18% increase in the number of projects submitted compared to the previous year. One of Eaton’s notable achievements is its inclusion in Newsweek’s 2023 Top 100 Global Most Loved Workplaces® list and certification by Great Place to Work® in 2023.
In the US, a survey conducted in early 2023 among 4,744 workers revealed that the majority of those whose workplaces offer specific policies or resources related to DEI reported a somewhat or very positive impact on their work. Meanwhile, in a Worldwide ERC® study of more than 600 top HR leaders, 98% responded that their organization has a DEI strategy in place, highlighting its value in the worldwide market.
According to Global Industry Analysts Inc.’s report, the global market for Diversity and Inclusion (D&I), estimated at US$7.5 billion in 2020, is expected to rise to US$15.4 billion by 2026, at a CAGR of 12.6% throughout the forecast period.
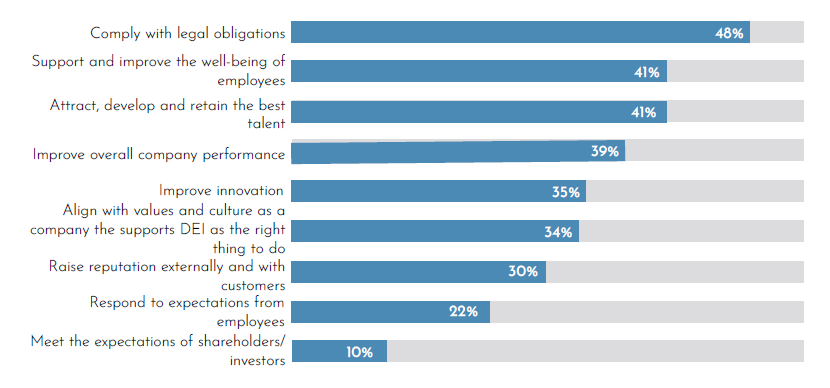
As cited in the International Labour Organization’s (ILO) report “Transforming enterprises through diversity and inclusion,” several studies have demonstrated that organizations fostering diverse and inclusive cultures consistently perform well, exhibiting enhanced adaptability, productivity, and resilience. The ILO conducted a survey in 2021 in which respondents were asked to identify the primary “drivers for action” on D&I that have the most significant impact on their companies (see Figure 2). The findings suggest that DEI initiatives correlate with both employee and overall business performance. In fact, 39% of respondents credited such initiatives with improving overall company performance.
This finding holds true because diverse teams bring together individuals with different backgrounds and perspectives. Diversity leads to innovative outcomes when combined with an inclusive culture that encourages employees to contribute their ideas. Moreover, inclusive workplaces instill a sense of belonging among all employees, regardless of their characteristics. Feeling valued and supported translates into increased engagement and motivation.
DEI-focused companies are appealing to job seekers, especially those from underrepresented groups. Recruiting leaders from diverse backgrounds also sets a powerful example of an inclusive leadership culture. Inclusive organizations tend to retain employees for longer. Reduced employee turnover saves time and cuts back on the costs associated with recruitment and training new staff.
Key Performance Indicators for DEI Programs
To fully harness DEI’s positive impact, organizations must not only implement dedicated programs but also rigorously measure their effectiveness. Thoughtfully selected key performance indicators (KPIs) enable companies to assess outcomes, monitor progress, and align DEI efforts with their goals.
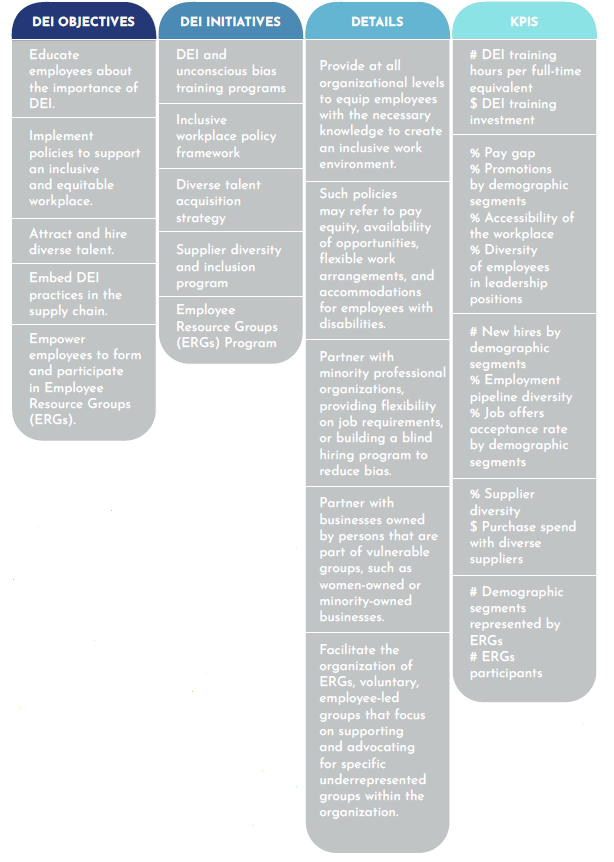
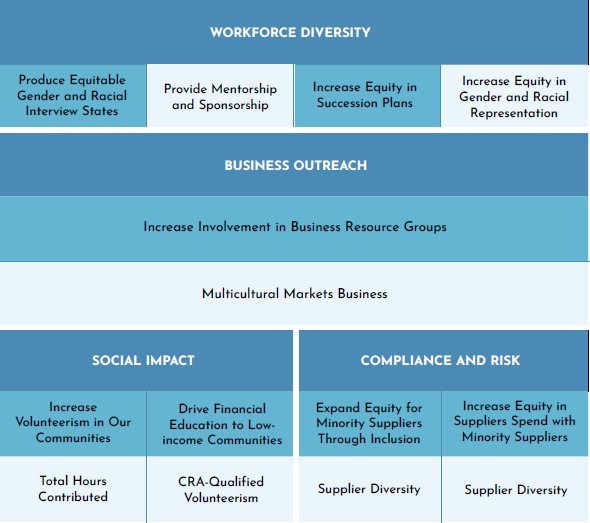
Figure 3 is an example of how organizations can monitor and enhance their DEI practices using The KPI Institute’s structured approach as outlined in their Terminology Standards. Each objective is aligned with specific initiatives and their corresponding KPIs, highlighting the essential link between setting DEI objectives, implementing well-defined initiatives, and tracking their outcomes. Moreover, the initiatives outlined in the table are characterized by their practicality and adaptability, making them applicable to a wide spectrum of industries and organizational structures.
Figure 3. DEI Initiatives and KPI Examples Arranged According to The KPI Institute’s Terminology Standards | Examples From Forbes, 2022; and Qooper, 2023
DEI in Action: the Comerica Bank Experience
Comerica Bank, dubbed by Newsweek as one of “America’s Most Responsible Companies,” has implemented several initiatives to foster inclusivity and promote diversity across all levels of the workplace. Some of them are the following:
Executive Diversity Committee (EDC): Composed of executive leadership, this committee develops and implements the organization’s DEI strategy. Its purpose is to address key issues, such as talent attraction and retention and the growth of a diverse workforce.
Diversity Recruiting Strategy: Comerica aims to prioritize creating a well-qualified and diverse applicant pool that mirrors the markets it serves. The bank forms partnerships and sponsors recruiting events with organizations supporting vulnerable communities.
Education: The DEI Education Council was formed to promote diversity, equity, and inclusion on a corporate-wide scale. This initiative hosts programs, events, and activities that aim to nurture a culturally competent organization. DEI education is mandatory for all Comerica employees.
Employee Resource Groups (ERGs): Comerica aims to encourage the formation of ERGs. These groups provide a platform for colleagues to connect, share experiences, and contribute to DEI efforts.
Supplier Diversity: Comerica also works on cultivating a diverse supplier base and supporting businesses owned by individuals from vulnerable groups. The bank’s standard agreements with suppliers enforce Comerica’s non-discrimination and diversity practices.
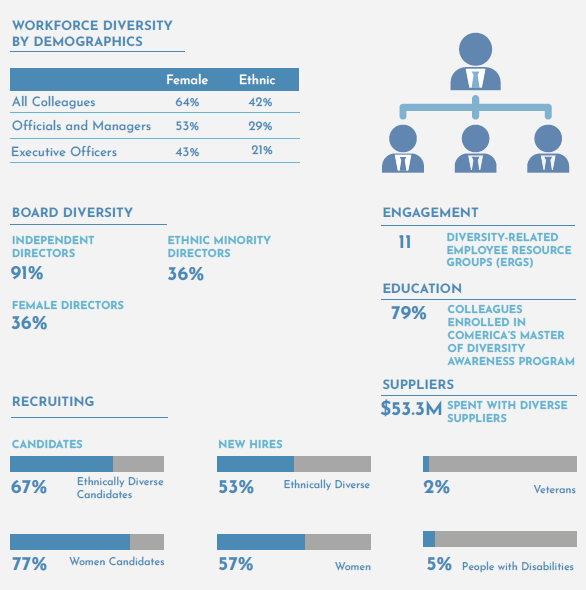
Figure 4. A Compilation of Comerica’s Results for DEI Initiatives | Adapted From Comerica DEI Report
Figure 4 shows Comerica’s DEI metrics as of the end of 2022. According to Comerica’s DEI report, the figures reflect the progress achieved by implementing the company’s DEI initiatives.
Comerica’s commitment to DEI initiatives has seemingly delivered positive results, benefiting its workforce and bolstering its reputation as a diversity and inclusion advocate. This commitment has been recognized by national and regional organizations and publications, placing Comerica “among the top US companies for its efforts to recognize and support DEI practice,” as stated in the report.
Comerica also utilizes an Annual Diversity Scorecard as a quantitative measurement tool to track progress toward documented short-term and long-term goals (see Figure 5). In the same report, the company states that every senior officer within the company, including executive officers, is responsible for contributing toward achieving their goals annually, directly affecting their performance rating and compensation. According to Comerica, all business units met their DEI performance targets in 2022.
Figure 5. Comerica’s Annual Diversity Scorecard | Adapted From Comerica DEI Report
Long-Term Commitment
Despite the growing recognition of DEI, challenges persist. Some companies tend to favor short-term, superficial solutions over comprehensive initiatives capable of driving lasting change. For genuine success, organizations must commit to driving positive change through a strategic approach to DEI, making it an integral part of their organizational culture. Companies must realize that DEI is a long-term commitment, necessitating continuous initiatives, dedicated budgets, and adequate resources.
Furthermore, it is important to prioritize the long-term outcomes of DEI initiatives over immediate outputs, while realizing that measuring progress should encompass not only quantitative KPIs but also qualitative insights that capture the sentiments and experiences of employees. It is through this transformative approach that organizations have the potential to craft inclusive, empowering workplaces that enable employees from all walks of life to thrive.
**********
Editor’s Note: This was originally published in Performance Magazine Issue No. 28, 2024 – Employee Performance Edition.
Image source: grapestock from Getty Images | Canva
In modern business, focusing on customer experience (CX) is no longer a nice-to-have, but rather a necessity for businesses of all sizes. However, defining a successful customer experience can be difficult because many touch points form the customer journey. By using online surveys, companies can gain quantitative information about the customer experience to actively monitor trends that develop over time. Based on customer feedback, organizations can identify areas for improvement, adjust their strategies accordingly, set better goals for their key performance indicators (KPIs), and strive to deliver the seamless experiences that today’s consumers expect.
Customer experience KPIs
Research shows that CX is now competing with traditional factors such as price and quality in influencing customer loyalty and advocacy. According to Forbes, 77% of consumers consider CX just as important as the main product or service itself. PWC reported that even beloved brands risk losing 32% of their customers after one negative interaction. In addition, poor CX burdens the company with costs. To address this, this article outlines five critical CX KPIs that can be systematically monitored, evaluated, and optimized to help address customer service problems and strengthen a company’s connections with its customer base.
1. % Customer satisfaction score (CSAT)
This KPI measures how customers rate particular interactions with a company, such as getting a response from customer care or processing a return. Users can score their satisfaction with the experience on a scale from “very dissatisfied” to “very satisfied” by responding to an automated questionnaire sent to them. Monitoring the ratings depends on a company’s objectives, but the general rule is that anything above 85% is excellent, and anything below 60% requires rapid attention.
Calculation: CSAT = (Number of Positive Responses / Total Number of Responses) x 100
2. # Net promoter score (NPS)
The NPS, considered the most famous CX KPI, reflects the willingness of consumers to recommend a product to friends and acquaintances. To calculate NPS, a company can conduct a survey of customers from one query: “What is the probability that you will recommend the product to your friends?” The answer is given on a 10-point scale, where 0 is “I will not recommend it in any case” and 10 is “I will definitely recommend.” The respondents can be divided into three groups depending on the scores obtained: promoters, passives, and detractors. The majority of companies consider a score above 80 as excellent, a score between 50 and 80 as very good, and a score below 50 as good.
An extension of the NPS index, the creation of the WoMI was motivated by criticism towards the traditional NPS. Researchers believed that the NPS made the incorrect assumption that if a customer does not recommend a product or service, then they are automatically considered detractors. This led researchers to make adjustments to the KPI in order to better reflect reality. It tracks the recommendation, but from the opposite perspective: “What is the probability that you will discourage people from doing business with the company?” This can be rated on a scale of 0 to 10. Those who choose 9-10 on the scale of “dissuading” are categorized as “true detractors.” The threshold varies from one industry to another. It is better to have a lower score, as the target for most companies is less than 10%. To gain a comprehensive understanding of your company’s position among customers, we suggest employing both approaches to obtain a complete picture.
WoMI = (Number of Promoters – Number of Detractors) / Number of Respondents * 100.
4. Consumer Effort Score (CES)
The CES index, which was developed in 2010, is related to the idea that the more effort the product or service requires from customers, the less likely they are to stay with the company. As cited in an article, research by the Corporate Executive Board (CEB) shows that 94% of customers who have an effortless experience are likely to make repeat purchases. The KPI could be measured by the customer’s response to a statement like: “Thanks to the service/product of company X. I was able to easily cope with my problem.” with a rating scale of 1 to 7. Most companies typically receive CES scores ranging from 5 to 5.5. A score exceeding 6 is generally considered above average.
CES = (Sum of response scores) ÷ (Number of responses)
5. Customer churn rate
Simply put, the churn rate is the number of users who stop any interaction with the company. Depending on the industry, this could mean that customers deleted their account, did not re-buy, or simply decided to switch to a competitor. In its simplest form, customer churn can be calculated by comparing the number of customers lost to the total number of customers. By dividing one metric by another, one can get the customer churn rate as a percentage of the total base. The most common acceptable churn rate is 5-7% annually.
KPIs must be monitored and measured in order to improve CX. To do so effectively, a system that accurately collects data from all channels should be considered. This allows requests to be categorized and common issues to be identified. In-depth interviews with both loyal and dissatisfied customers should be conducted to understand the root cause of any problems, as some of which could be related to support services. Consistency in tracking and improving CX KPIs is the key to ensuring decisions and actions in customer service adapt to changing customer sentiment and meeting their needs.
Take your CX to the next level! Visit smartKPIs.com for a comprehensive, 360-degree view of CX KPIs. For more in-depth articles on KPIs, click here.
Globally, up to 2.78 million workers die annually from occupational accidents and work-related diseases, while another 347 million suffer from non-fatal occupational accidents, according to the United Nations Global Compact.
Dealing with work-related accidents severely impacts corporate management performance by generating direct and indirect costs and repercussions. Some of these are medical costs, losses due to production downtime, loss of productivity, and low employee morale. A company can also be sanctioned by authorities or suffer from reputation damage, which in turn may result in sales reduction.
Thus, occupational safety and health (OSH) is a priority for businesses. OSH is the practice of protecting the safety and health of employees by identifying workplace hazards and implementing initiatives meant to prevent their occurrence. OSH standards and regulations exist at the international and the national levels, and companies are responsible for adopting them.
To support OSH, the International Labour Organization and the United Nations Global Compact identified business practices to improve workplace safety and health, and one of which encourages companies to “enhance the reporting, recording, and notification of occupational injuries and diseases to improve data collection.” Through the improved recording of workplace mortality and morbidity, companies and authorities can evaluate the performance of internal OSH systems, prioritize OSH initiatives, and enhance corrective actions and prevention efforts.
The performance of such initiatives can be tracked with the help of health and safety key performance indicators (KPIs), such as # Lost Time Injury (LTI), # Lost Time Injury Frequency Rate (LTIFR), % Health and safety (H&S) incident type breakdown, % Health, security, and safety training completed, % Compliance OSH regulations, and % Lost day rate.
The healthcare manufacturing industry is a high-risk industry when it comes to occupational safety and health due to the nature of the products and the operating environment. The OSH problems faced by workers in this industry include exposure to chemical and biological substances, exposure to physical hazards, ergonomic affections, and hazardous processes using heavy machinery.
Medtronic and Johnson & Johnson are renowned corporations in the industry and have established a strong presence in the market. Both companies stated their strong commitment to ensuring the well-being of their employees and have implemented comprehensive OSH systems.
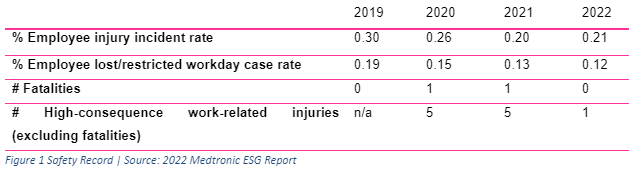
Medtronic, a global leader in medical technology, services, and solutions, strongly focuses on health and safety, implementing enterprise-wide standards to reduce hazards and risks and prevent workplace accidents. Their Environmental, Health, and Safety Performance System monitors the recordable incident rate, employee training, and auditing while providing employees with tools to reduce risks and employ safe behaviors.
As revealed by the KPIs’ results for the last four years, Medtronic’s EHS system achieved notable progress in enhancing workplace safety. Three of the indicators have shown a decreasing trend compared to previous years. Only the % Employee injury incident rate has slightly raised due to an increase in slips, trips, and falls, as stated in the company’s ESG Report.
To address the issue, the company launched a comprehensive awareness campaign across all its sites and took measures to improve outdoor walking surfaces and lighting where deficiencies were detected.
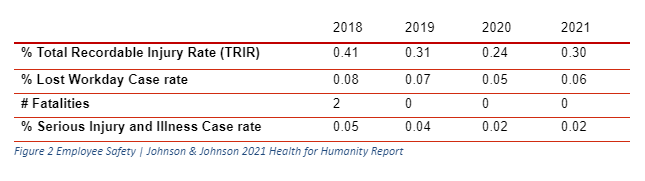
As part of the ongoing initiatives that supported continuous improvement, Medtronic implemented a companywide hazard reporting tool, which allows employees to report potential risks and near-miss incidents. This enables the company to take timely mitigating measures and reduce the likelihood of incidents. Johnson & Johnson, a popular healthcare company that produces a wide range of medical devices, pharmaceuticals, and consumer packaged goods, has implemented thorough safety programs, risk assessments, and training for its employees.
Johnson & Johnson’s OSH system incorporates a global data management system with digital tools, predictive analytics, and visualization tools to track the OSH KPIs, gain deeper insights into their performance, and identify potential risks early.
Using leading indicators facilitates a proactive avoidance of workplace injuries. Examples of leading KPIs the company uses include # Corrective and Preventive Actions (CAPA) resulting from program evaluations, internal audits, and # Near misses.
The company’s recent focus was to prioritize resources and risk mitigation efforts to prevent those incidents that could lead to life-threatening or life-altering outcomes. By following the hierarchy of controls, with an emphasis on eliminating, substituting, or engineering controls rather than relying on administrative controls, the company was able to reduce indicators of fatalities and serious injuries.
Despite this, the other two KPIs showed a slight increase in 2021, contrary to the downward trend seen in previous years.
KPIs Drive Occupational Safety and Health Performance
There is no one correct formula for employee safety. Starting from the authorities’ standards and recommendations, companies should develop OSH systems tailored to their needs. Business practices focused on employees’ participation in risk identification, periodic audits, OSH training, safe behavior stimulation, and awareness activities could help create a preventive and safety culture.
As shown by the examples of Medtronic and Johnson & Johnson, top-tier companies operating in a high-risk sector, regardless of the chosen initiatives, effective systems enhance the recording and reporting of OSH KPIs.
Monitoring the leading indicators to proactively identify potential risks and implement mitigation measures and lagging indicators to understand the current deficiencies and apply corrective actions can determine the success of an OSH system in creating a safer, healthier, and more efficient workplace.


