Gartner releases its 2018-19 Magic Quadrant for BI & analytics
Back in 2016, Gartner redesigned the Magic Quadrant for BI and analytics platforms to reflect a new, more modern, user-centric business perspective, compared to the older IT-defined enterprises.
The multiyear transition to modern agile and business-led analytics is now mainstream, with double-digit growth; meanwhile, spending for traditional BI has been declining since 2015, when Gartner first split these two market segments.
Initially, much of the growth in the modern analytics and BI market was driven by business users, often through small purchases made by individuals or within business units.
As this market has matured, however, IT has increasingly been driving – with the influence of business users, the expansion of these deployments as a way of broadening the reach of self-service analytics, but in scalable way.
The crowded analytics and BI market now includes everything from longtime, large technology players to startups backed by enormous amounts of venture capital.
Platform leaders
Magic Quadrant ranking indicators
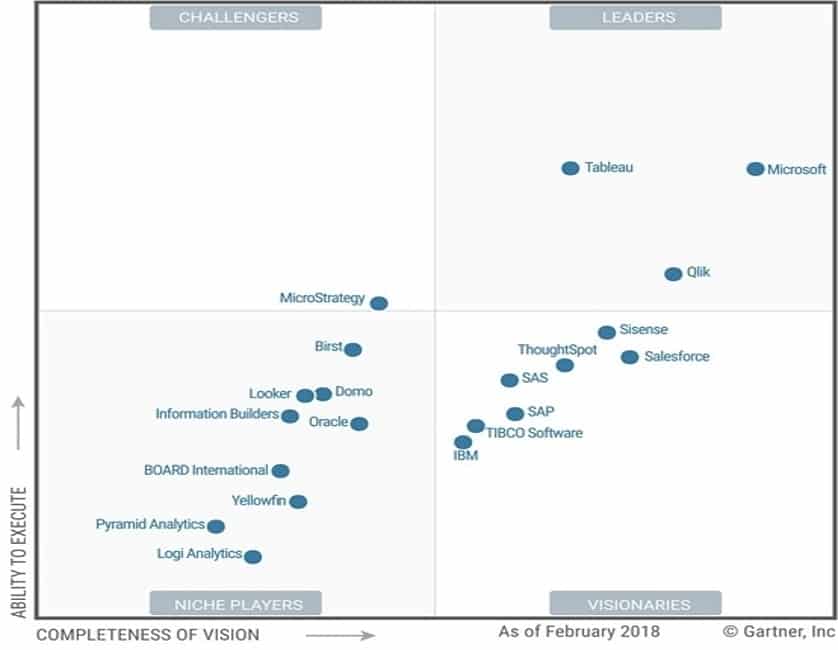
The Gartner quadrant ranks the BI and analytics platforms based on their ability to execute, correlated with their completeness of vision.
Gartner uses a series of ranking variables which are called “use cases”. Analytics vendors are assessed for their support of five main use cases:
- Agile Centralized BI Provisioning
Supports an agile IT-enabled workflow, from data to centrally delivered and managed analytic content, using the self-contained data management capabilities of the platform.
- Decentralized Analytics
Supports a workflow from data to self-service analytics. Includes analytics for individual business units and users.
- Governed Data Discovery
Supports a workflow from data to self-service analytics to SOR, IT-managed content with governance, reusability and promotability of user-generated content to certified SOR data and analytics content.
- OEM or Embedded BI
Supports a workflow from data to embedded BI content in a process or application.
- Extranet Deployment
Supports a workflow similar to agile centralized BI provisioning for the external customer or, in the public sector, citizen access to analytic content.
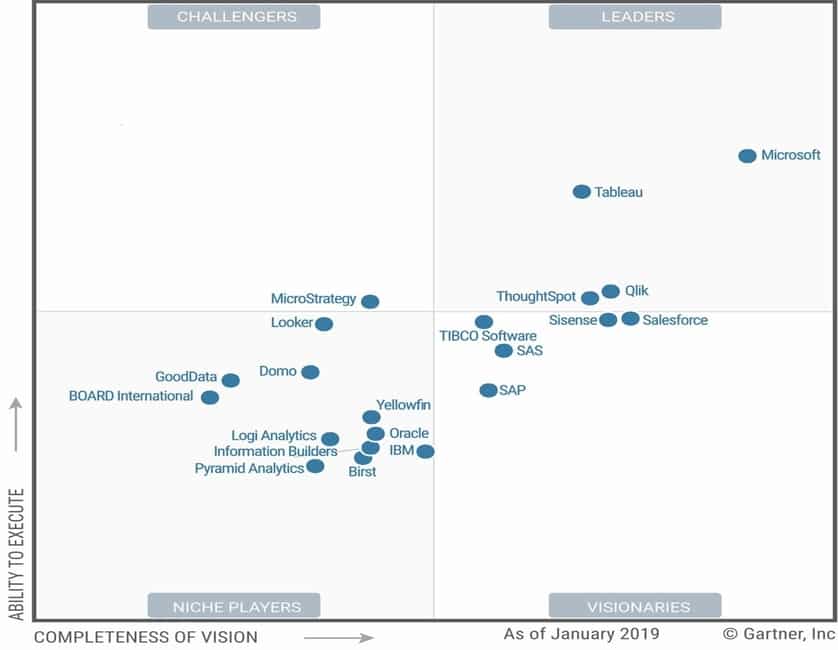
Magic Quadrant Results
BI Leaders – For 2018, these were Microsoft, Qlik and Tableau. In 2019, ThoughtSpot joins the ranks of Leaders, from a high position in the Visionaries category.
One major reason for ThoughtSpot joining the Leaders ranks is the fact that in the 4th quarter of 2018, they released SearchIQ, an analytics service platform that supports voice-driven mobile queries, and Proactive alerting, which notifies users of any unusual changes in data, going against the traditional threshold-based notifications.
With 78% of reference customers using ThoughtSpot products for decentralized analytics and 62% for agile, centralized BI provisioning, ThoughtSpot managed to climb up to the ranks of leaders due to its adaptive innovation, high customer satisfaction and study execution.
Challengers – MicroStrategy remained the sole challenger in both 2018 and 2019. This is due to the fact that going into 2019, it has only improved its already well-established platform. For those who are not familiar with the company, MicroStrategy combines data preparation, visual- and NQL-based data discovery & exploration, dashboards and mobile capacities with enterprise analytics and BI.
In 2019, it has improved its semantic graph, to allow for crowdsourced content recommendations and has also promised to invest into augmented analytics. The company’s semantic graph also represents the main focal point of a new category of content – HyperIntelligence. HyperIntelligence overlays and dynamically surfaces predefined insights within existing applications, such as browser-based applications and search results.
Visionaries – With ThoughtSpot ascending to BI Leaders, TIBCO Software has become the new contender to Sisense and Salesforce. From second to last place, to the main rival of two long-time visionary leaders, TIBCO Software is our first example of an impressive redemption story.
Through acquisitions and original equipment manufacturer (OEM) relationships, it has grown its capabilities to new ends. Nowdays, TIBCO capacities include data science, ML and streaming analytics, location intelligence, data cataloging and data virtualization.
Its latest release — Spotfire X — adds automated insight generation, NLQ and augmented visual data preparation. It also includes enhancements to real-time analytics and a single, simplified user interface.
Niche players – In 2018, the leaderboard for this category was comprised of Birst at the top and then Looker & Domo on equal footing behind it. In 2019, the tables have not only been turned, but jumbled up a bit, as Looker has become the uncontested leader, with Domo following in its footsteps and a new addition to the Niche players category – GoodData, stepping up to number 3. Birst has fallen to the wayside, all the way down to the penultimate position.
Looker has been crowned the Niche players leader due to the fact that in the second half of 2018, it has added integrations for data science use cases including support for Google BigQuery ML, as well as Action Hub integrations that enable data to be moved to other apps, including TensorFlow.
It also released a digital marketing application, the first of several planned domain analytical applications. Moreover, later on that year, in November, the company released Looker 6, adding support for MongoDB and dashboard performance improvements.
Unfortunately for Birst, they have fallen far from grace, even with the fact that in 2017, they were acquired by Infor and now act as a stand-alone subdivision within the company. The acquisition did not mend Birst’s issues when it comes to the quality and timeliness of support.
On top of that, Gartner registered a net reduction in searches and inquiries related to Birst. Reference customers’ replies, when inquired about this fact, highlighted a decline in the product’s viability on the market, as they feel that Birst’s end-to-end data warehouse, reporting and visualization platform built for the cloud is no longer an outstanding & unique selling point.
Future trends
Finally, the Gartner report isolated the BI and analytics platforms trends for the near future. According to them, by 2020:
– a paradigm that includes natural language query and narration, augmented data preparation, automated advanced analytics and visual-based data discovery capabilities — will be a dominant driver of new purchases of business intelligence, analytics and data science and machine learning platforms and of embedded analytics;
– the number of users of modern business intelligence and analytics platforms that are differentiated by augmented data discovery capabilities will grow at twice the rate, and deliver twice the business value of those that are not;
– natural-language generation and artificial intelligence will be a standard feature of 90% of modern business intelligence platforms;
– organizations that offer users access to a curated catalog of internal and external data will derive twice as much business value from analytics investments as those that do not.

Tags: Analytics, Magic Quadrant, Microsoft

