Investment bankers views on the 2010 World Cup South Africa – The World Cup and Economics 2010
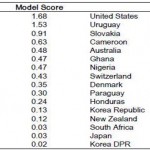
The 2010 report on the The World Cup and Economics was recently released by the Global Investment Research Division of Goldman Sachs. Besides forecasting football scores and rankings, the report presents an analysis regarding the correlation with other types of indicators within the World Cup context.
- Gross National Product (GNP) per Capita – measures the dollar value of the outputs (goods and services) produced within a country, divided by the number of its citizens (smartkpis.com, 2010)
- Growth Environment Scores (GES) – represents a composite measure of growth conditions for 170 countries, aimed at summarizing the overall growth environment. Goldman Sachs introduces the GES in 2005, to rank countries according to their ability to achieve their growth potential. (Goldman Sachs, 2006)
After testing statistically both GNP per capita and GES with the current FIFA rankings, the conclusions were:
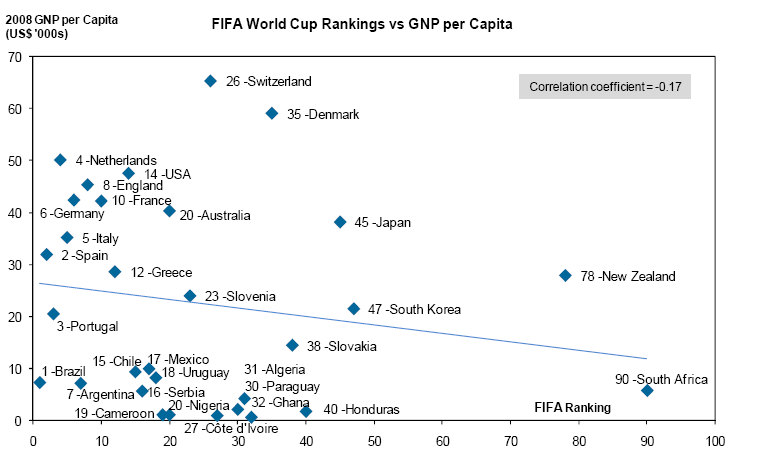
- The correlation between GNP per capita and the current FIFA rankings is –0.17, lower than the correlation in 2006 (–0.41), this being an indication of a weak relationship between GNP per capita and a country’s FIFA ranking.
FIFA World Cup Rankings vs GNP per Capita
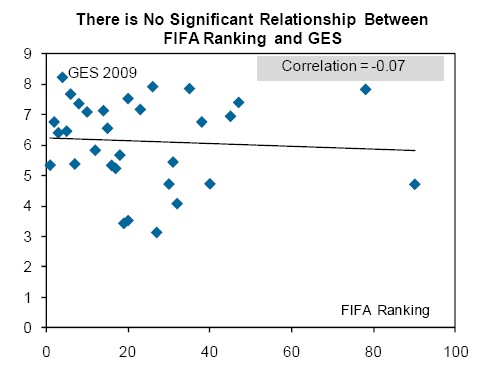
- Overall, the correlation between GES and FIFA rankings is also weak, only –0.07. For developed countries, the correlation is 0.29, while for developing countries it is –0.004. A reason for this low correlation level is Brazil and Argentina, for which, their GES cannot explain their high ranking.
GES and FIFA Ranking correlation score
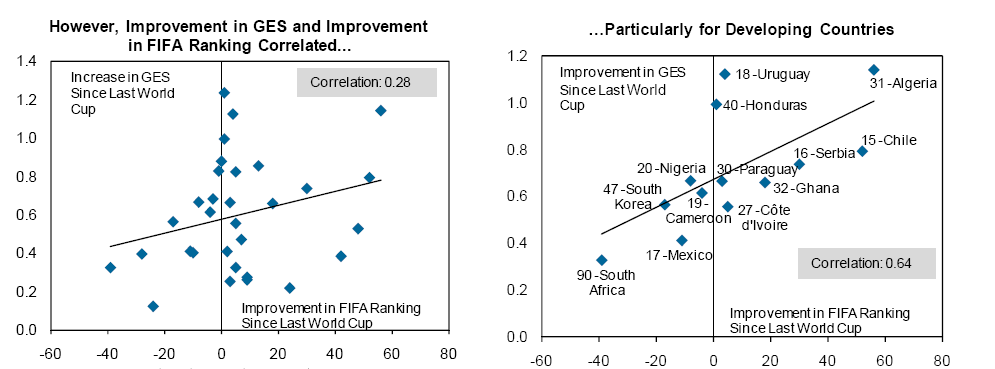
Improvement in GES and FIFA Ranking
- For the smaller emerging markets, the improvement in GES could conceivably be associated with better infrastructure and funding facilities for football. For example, Algeria has improved the most among developing countries, in both its GES and FIFA ranking. (Goldman Sachs 2010)
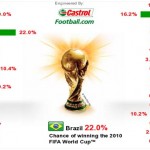
At its fourth edition, World Cup and Economics 2010 report presents also football statistics and odds for each country, offering even an intriguing exercise that calculates probabilities for the likely winner of the Cup.
References:
- Goldman Sachs 2010, The World Cup and Economics 2010
- Goldman Sachs 2006, You Reap What You Sow: Our 2006 Growth Environment Scores
- smartkpis.com (2010), Gross national product per capita
- plus.google.com
- Goldman Sachs, 2010

Tags: Performance in South Africa, Sports performance, The World Cup and Economics, World Cup 2010

