San Diego – Regional Quality of Life Dashboard
The San Diego Regional Quality of Life Dashboard was initiated in 2009 by the Equinox Center, an independent, not profit research and policy center that helps the San Diego region achieve a more prosperous economy and improve the quality of life of its residents.
The main purpose of implementing this tool was to shed light on the questions that matter to San Diegans, which are related to the resources available and which can or cannot continue providing economic opportunities for all the region’s inhabitants, or if transportation networks allow them to move easily from their homes to jobs and so forth.
Equinox Center’s dashboard combines data collection and analysis with research, being able to provide a balanced snapshot of the region’s quality of life through credible data, clear key performance indicators and benchmarks. Whether an indicator is trending up or down, the dashboard provides ideas on how the results can be improved in the future.
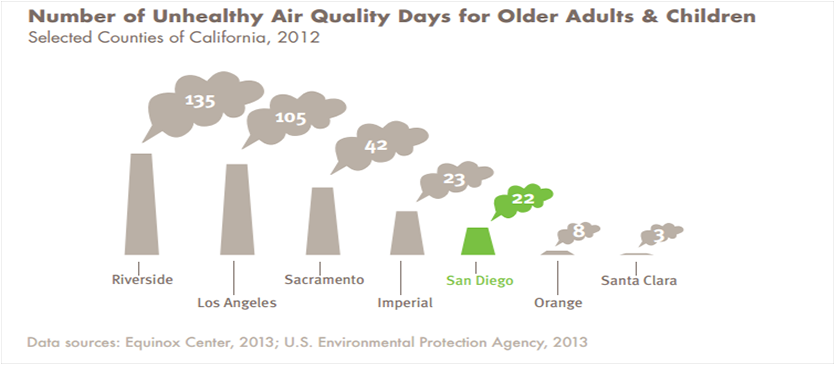
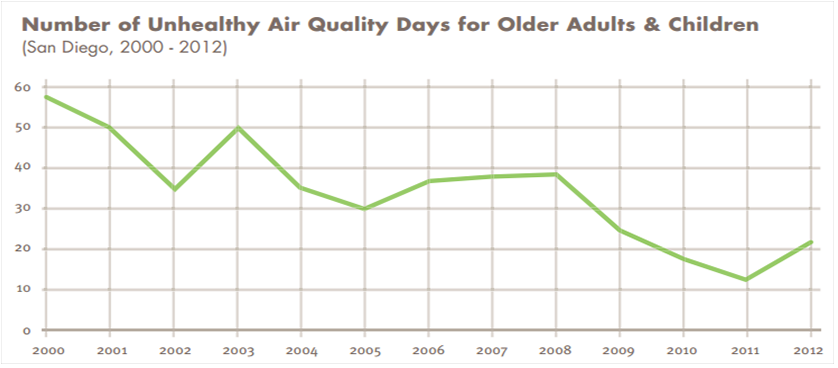
The charts and infographic-like diagrams facilitate comparisons between San Diego and state benchmarks, other regions, or even between San Diego communities. The type of graphs used are line graphs, which allow viewers to easily track trends and KPIs’ evolution in time against specific targets, and bar charts to spot level differences in data sets.
Through the set of key performance indicators monitored in the dashboard, Equinox Center can measure progress in relevant areas and quickly identify where action should be taken. The dashboard publication is updated annually, but the online version is more frequently updated.
References:
- Equinox Center (2014), Quality of life dashboard
- Equinox Center (n.d.), About the regional quality of life dashboard
Image source:

Tags: Dashboard, Performance in USA, Performance Measurement


