Software solutions review: Qlikview and Tableau
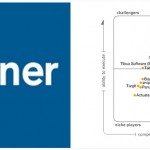
Every year, Gartner releases one of its most popular tools, Magic Quadrant for Business Intelligence and Analytics platforms. This Magic Quadrant ranks software solutions based on three indicators: information delivery, analysis and integration.
According to Gartner, the most comprehensive and well-positioned software solutions are QlikView and Tableau. A comparative analysis for the above mentioned solutions is provided below:
QlikView
QlikView has become the market leader due to its advantage in data discovery, a segment of the BI platform market that it established. QlikView is a self-contained BI platform, based on an in-memory associative search engine, a growing set of information access and query connectors, with an ensemble of deeply integrated BI capabilities.
This software has a high level of simplicity in order to be user-friendly, and it is perceived as cost effective and with fewer limitations compared to its competitor software solutions.
QlikView embraced one of the most difficult strategies of any vendor: to address the enterprises’ unmet need for a BI platform standard that can accomplish both business users requirements for ease of use and IT`s requirements for enterprise features relating to reusability.
Tableau
Tableau’s intuitive, visual-based data discovery, dashboarding and data compilation capabilities have met business users’ expectations about what they can discover in data and share without requiring comprehensive skills or training with a BI platform.
Tableau’s organizational vision is structured on a road map based on evolution in order to enable users to meet enterprise requirements for reusability and scalability.
According to Gartner’s surveys, Tableau recorded strong results for customer satisfaction, a high score on ease of use for end users and developers and a high score on functionality.
Analogy between QlikView and Tableau:
1. Combine data
This is a very simple process with both Tableau and QlikView. The only major difference between the two of them is that QlikView offers the wizard feature and Tableau realizes the data linking through clicking. However, they are both very simple and user friendly.
2. Creating charts/graphics
The difference between the two software solutions consists of the fact that Tableau offers the drag and drop solution, making it very flexible and simple to move one category to another. Also, the chart is automatically generated and ready to offer the information desired, unlike QlikView, where the user has to go through the wizard and generate the bar chart again. The automatic generated colors feature available with QlikView is a plus compared with Tableau, as the later one forces users to select the color wanted.
3. Highlighting one category
When you click on a category such as “publications” in QlikView it turns green and all elements relevant for it turn white, while the irrelevant ones turn gray. On the other hand, when using Tableau, the irrelevant data becomes hidden when clicking the “publications” category, and publication related sales are highlighted.
4. Showing different charts/graphics
The time spent on finding out for example how much profit is earned in each product category is really important for a BI tool. Tableau is all dragging, dropping, pulling and pressing buttons which are visible and well placed right in front of the user and the results appear right in front of one’s eyes. From this point of view, QlikView resembles old software solutions, where you have to uncheck and check everything you need. Based on this, it can be inferred that QlikView is rather time consuming and even overwhelming for a new user.
5. Dashboards
Creating dashboards in Tableau is pretty straightforward. It is very efficient to drag and drop / delete or add any filters that are needed in order to receive the information needed. On the other hand, in QlikView it is somehow more time consuming to create a dashboard, as it requires a rather highly skilled user.
If a conclusion from the user’s point of view is to be drawn, although both Tableau and QlikView are highly rated products which provide almost the same features in analyzing data, Tableau offers the advantages of being less time consuming and not require a high level of competency due to its very intuitive and user-friendly interface.
References:
- Gartner (2014), Magic quadrant for business intelligence and analytics platforms
- Salim, S. (2014), In memory analytics
- Nanduri, P. (2014), Five business intelligence predictions for 2014
Image source:

Tags: Business Intelligence, Software


