KPIs and Dashboards in practice: TrackDC an innovative District of Columbia Performance Management initiative
Performance measurement and reporting for control is not the sole purpose of tracking results against targets. One of its very important dimensions is that of enhancing accountability towards stakeholders; in private-owned organizations, reporting is directed mostly to shareholders and managers, whereas in governmental institutions, communication is directed towards the entire community served.
Usually, government accountability and reporting comes in the shape of annual performance reports, made public on the various agencies’ or local cities’ websites. smartKPIs.com – KPIs in practice section – includes various such annual reports, the ones below being only a part of the tens of governmental reports contained:
- U.S. Environmental Protection Agency
- Maryland Department of Budget and Management
- Sheffield City Council
However, more complex initiatives are on their way, governments seeking not only to release a descriptive report covering one year’s activity, but also put in place more user-friendly reporting tools, with increased usability, based on Performance Management Dashboards.
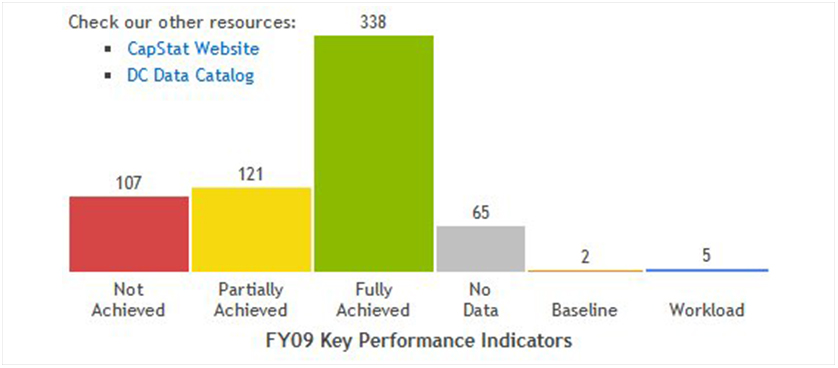
A pioneer in this area seems to be the District of Columbia, which developed an online application called TrackDC, where citizens can visualize Key Performance Indicator results in graphs, check Budget distribution and spending, have access to permanent news and learn more about agencies and their Performance Plans and Accountability Reports.
The website contains individual pages for all the 53 agencies, with agency profile section, the annual Performance Plans and Reports, Performance Indicators, Customer Service data and Budget & Operational information.
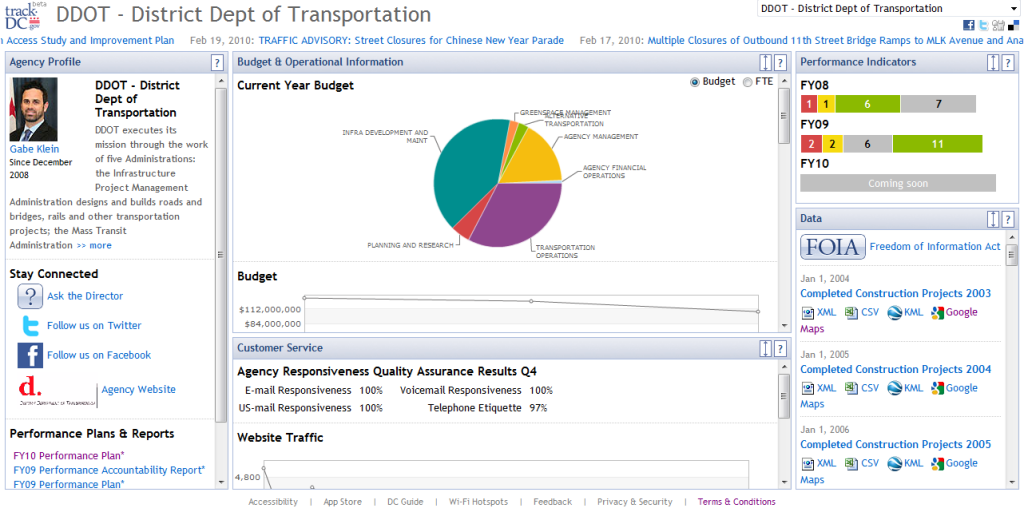
For a complete picture, you can access for example the District Department of Transportation page:
Source: District of Columbia, District Department of Transportation, 2010
The Department’s 2010 Performance Plan includes performance measures in areas ranging from Finance, Contracts and Customer Service, to People, Properties and Risk. Several examples are the following:
- % Sole-source contracts
- % Variance between agency budget estimate and actual spending
- % Employee turnover rate
- # Square feet of office space occupied per employee
You can see that the Agency Responsiveness Quality Assurance Result for Q4 was of 97,09 %, against a 87,47 % Citywide Average.
You can also check the daily Website Traffic Dashboard, covering website traffic numbers for the last month’s period.
The Key Performance Indicators vary from one agency to another, being broken down from the objectives and initiatives each individual agency identifies. However, reporting is the same for each agency, covering the sections mentioned above.
References
District of Columbia (2010), “Track.DC”

Tags: Dashboard, Government performance, KPI, Performance in USA, Performance Management, Performance Measurement, TrackDC


