2009 Best and worst airport on time performance
Nothing is worst than having to wait in a crowded airport for hours and hours or miss your connection flight because of a delayed aircraft. Such situations can create a lot of frustration and tension among passengers and usually lead to a lot of headaches for the airline representatives.
According with an EUROCONTROL (The European Organization for the Safety of Air Navigation) research from 2007, the major factors responsible for aircraft delays in Europe were airlines which accounted for 55% of the total fallowed by airports’ ground personnel (12%), air traffic control (10%) and weather (10%).
The situation is even worse if we consider that an airline delay is very hard to redress and in most of the cases leads to reactionary delays throughout the airline network system.
Thus, faced with these situations, airline operators have to cope with an avalanche of complaints, find alternative traveling solutions, make reimbursements or pay damage compensations, which in the end can seriously affect the bottom line of the companies.
Therefore delivering the best in class on time performance becomes a major challenge and in the same time responsibility for both airport authorities who administer these congested points as well as for the airline operators who are directly involved in passenger transfers.
More than ever, on time performance is considered today one of the most important key factors to success for the airline industry. It is usually expressed by two important key performance indicators:
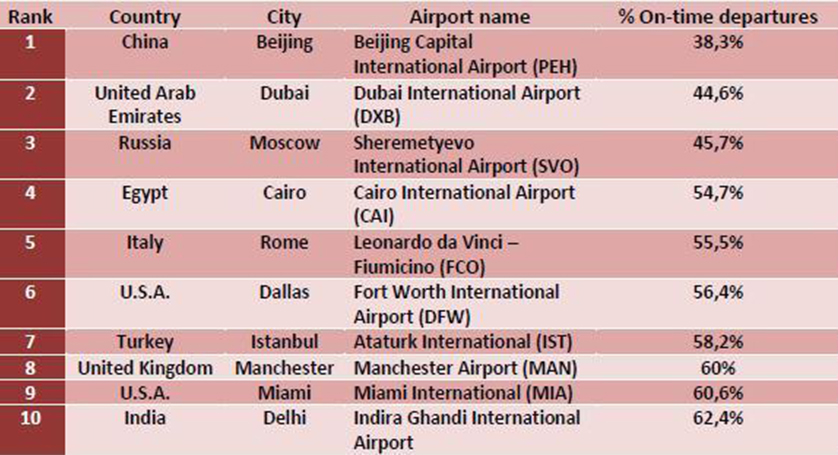
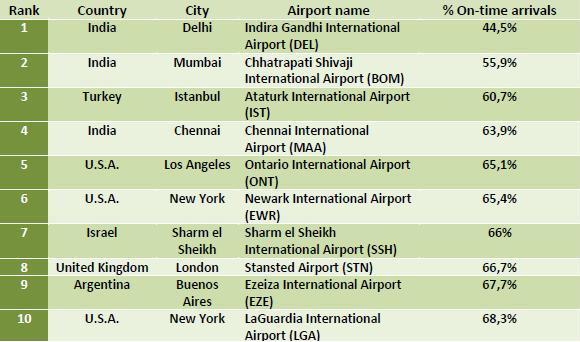
While some operators prefer to adjust the tolerance intervals, in general a flight is considered “on time” if it arrives or departs less than 15 minutes after its scheduled take-off or landing time. What is beyond this time landmark counts for the negative side of airline companies “on time performance”. Knowing the “hotspots” in the industry, the airports with the worst on time record, is important for both airlines and passengers, that can use this information as part of their risk management plans. In January 2010, the Forbes Magazine compiled a report presenting the ten most delayed airports in term of “on time performance” for both arrivals and departures (Forbes, 2010). A summary of the results is outlined below:
Worst departure ranking
Worst arrival ranking
For more details about the major factors that can influence airline industry performance, smartkpis.com (eab group, 2010) provides its users with a comprehensive library of performance measures such as:
• # Average minutes delayed for all flights
• # Average arrival processing time
• % Lost baggage on connection flights
• % Flights delayed due to technical issues
• % Flights delayed due to weather conditions
Additional resources
References:
- Forbes (2010), “The World’s Most Delayed Airports”
- smartKPIs (2010), “KPI examples for the Airport
- smartKPIs (2010), “KPI Examples for the Airlines
Image Source:
To compile our list, we use information from FightStats, an aviation data company which compiles flight information from airports, airlines, flight reservation systems and other sources around the world. We considered flights at the world’s 200 busiest airports by passenger volume, according to Airports Council International’s 2009 World Traffic Report. We included only airports about which FlightStats has the most detailed information. That means that some airports, particularly large hubs in South America, weren’t considered for our list.

Tags: Airlines performance, KPI in Practice, Report Analysis, Transportation performance


